Ask Singapore Homework?
Upload a photo of a Singapore homework and someone will email you the solution for free.

Question
secondary 4 | A Maths
4 Answers Below
Anyone can contribute an answer, even non-tutors.

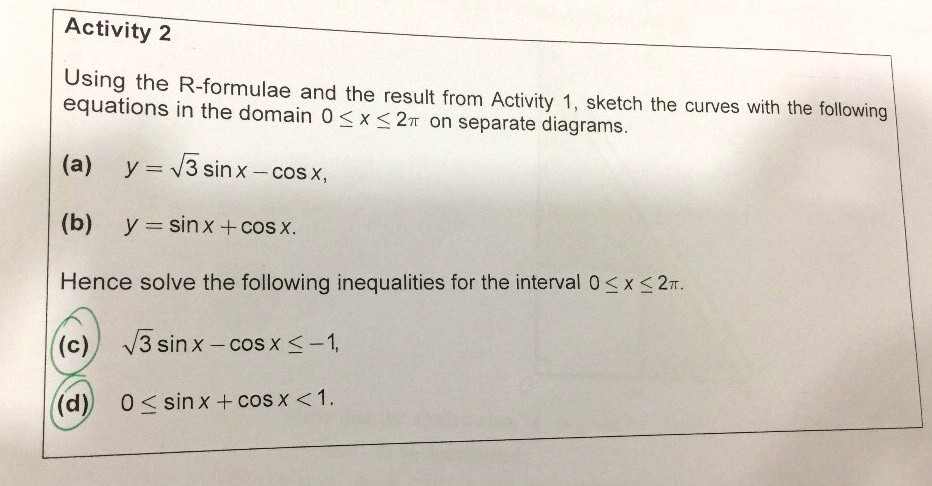
Very confused on how to solve part c and d. Would appreciate detailed worked solution. Thanks!!
Date Posted: 4 years ago
Views: 197

(c)
consider eqn:
√3 sin x - cos x = -1
this can be broken into 2 simul, eqns:
y = √3 sin x - cos x
&
y = -1
in part (a), u hv sketch the graph y = √3 sin x - cos x ,
now all u need is to add y = -1 into the same sketch.
the two graphs shld intersect at a few point
the soln to the inequality
√3 sin x - cos x ⩽ -1
is to read the x-axis where the graph y = -1 is above the graph y = √3 sin x - cos x .
.

I suspect secondary A Maths students do not learn how to draw the graphs of y = a sin (bx + c) + d. Specifically, they only learn bx and not bx + c.
See 4 Answers
done
{{ upvoteCount }} Upvotes
clear
{{ downvoteCount * -1 }} Downvotes
Good evening Cheryl! For part c and d, I have included a shaded region for the relevant inequalities. To solve for the values, we must first pretend that the inequality signs are now equal signs so that we can find the limits of our shaded region and then define the region of inequality.
Date Posted:
4 years ago
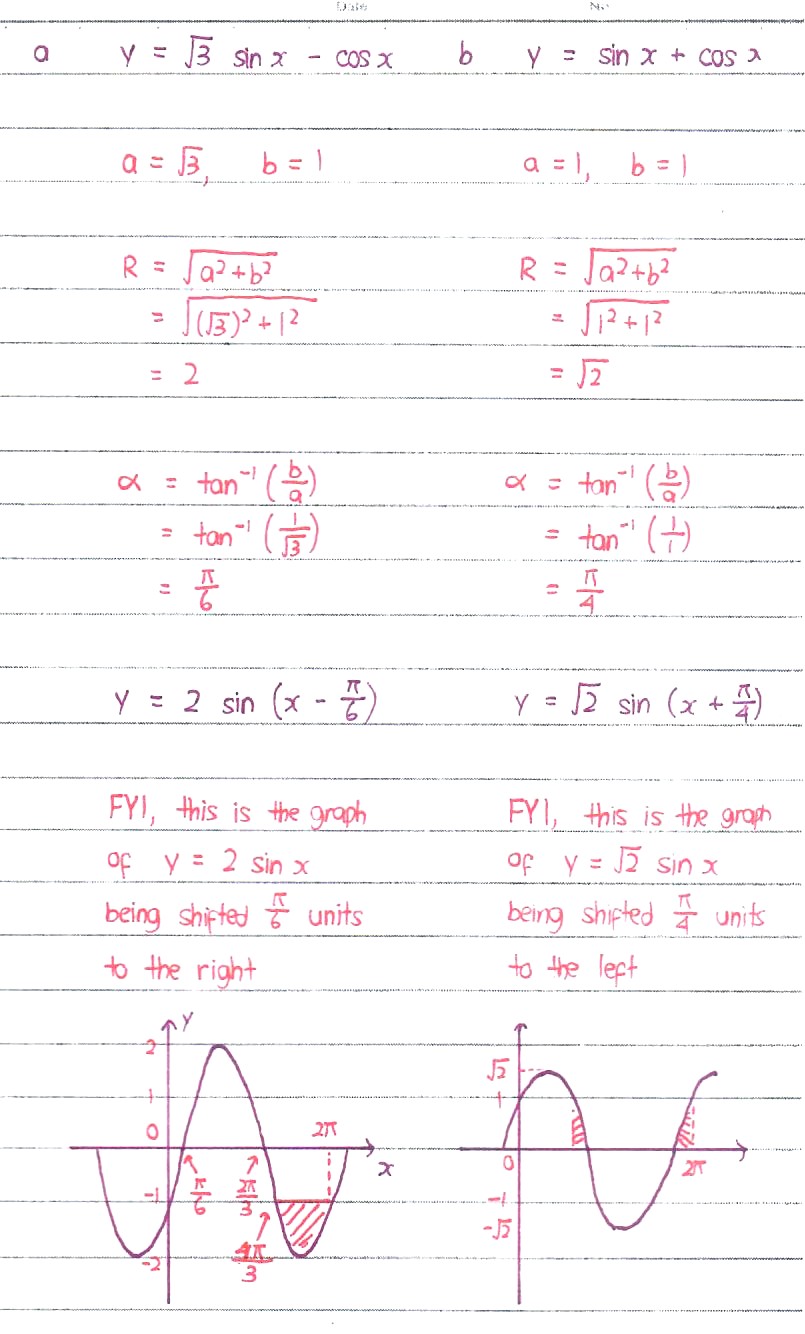
I will next do up the relevant written approaches followed by graphical representations on Desmos.
Thank you!!!
done
{{ upvoteCount }} Upvotes
clear
{{ downvoteCount * -1 }} Downvotes
Good evening Cheryl! I know this question is tough and I expect you to have some questions regarding this, let me know if you need more explanation.
Basically, in linear inequalities like say, x - 2 > 0, we can say that the set of solutions is x > 2, because a straight line never changes its direction of travel. Once it crosses the x-axis at x = 2, it will never ever return to the x-axis again, so we are certain that x > 2.
However, in quadratic inequalities, we cannot say that if (x + 2) (x - 2) > 0, we cannot break this up into two inequalities x + 2 > 0 and x - 2 > 0, because the behaviour of quadratic graphs is not the same as the behaviour of a straight line graph. For a quadratic smiley face graph we know that the graph will start up high at first, goes down to cross the x-axis and reach a minimum below the x-axis and then turns back up. As such, by inspection of the graph sketch, we can conclude that x + 2 < 0 or x - 2 > 0, because that is how a quadratic graph works.
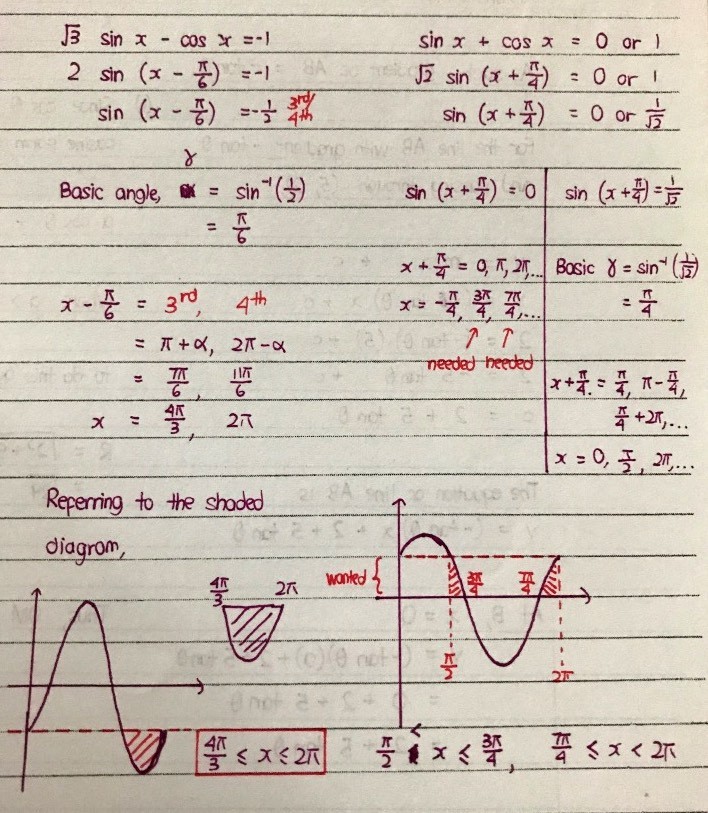
For a similar reason to the quadratic case, we sketch out the sine graph to see where the appropriate region of shading should be. This facilitates correct representation of our required inequalities. Here, for part c, it’s 4pi/3 <= x <= 2 pi because in this section of the graph, the graph will be on or below the line y = -1. For part d, it’s a similar idea and in fact there are two separate regions to describe.
Basically, in linear inequalities like say, x - 2 > 0, we can say that the set of solutions is x > 2, because a straight line never changes its direction of travel. Once it crosses the x-axis at x = 2, it will never ever return to the x-axis again, so we are certain that x > 2.
However, in quadratic inequalities, we cannot say that if (x + 2) (x - 2) > 0, we cannot break this up into two inequalities x + 2 > 0 and x - 2 > 0, because the behaviour of quadratic graphs is not the same as the behaviour of a straight line graph. For a quadratic smiley face graph we know that the graph will start up high at first, goes down to cross the x-axis and reach a minimum below the x-axis and then turns back up. As such, by inspection of the graph sketch, we can conclude that x + 2 < 0 or x - 2 > 0, because that is how a quadratic graph works.
For a similar reason to the quadratic case, we sketch out the sine graph to see where the appropriate region of shading should be. This facilitates correct representation of our required inequalities. Here, for part c, it’s 4pi/3 <= x <= 2 pi because in this section of the graph, the graph will be on or below the line y = -1. For part d, it’s a similar idea and in fact there are two separate regions to describe.
Date Posted:
4 years ago
done
{{ upvoteCount }} Upvotes
clear
{{ downvoteCount * -1 }} Downvotes
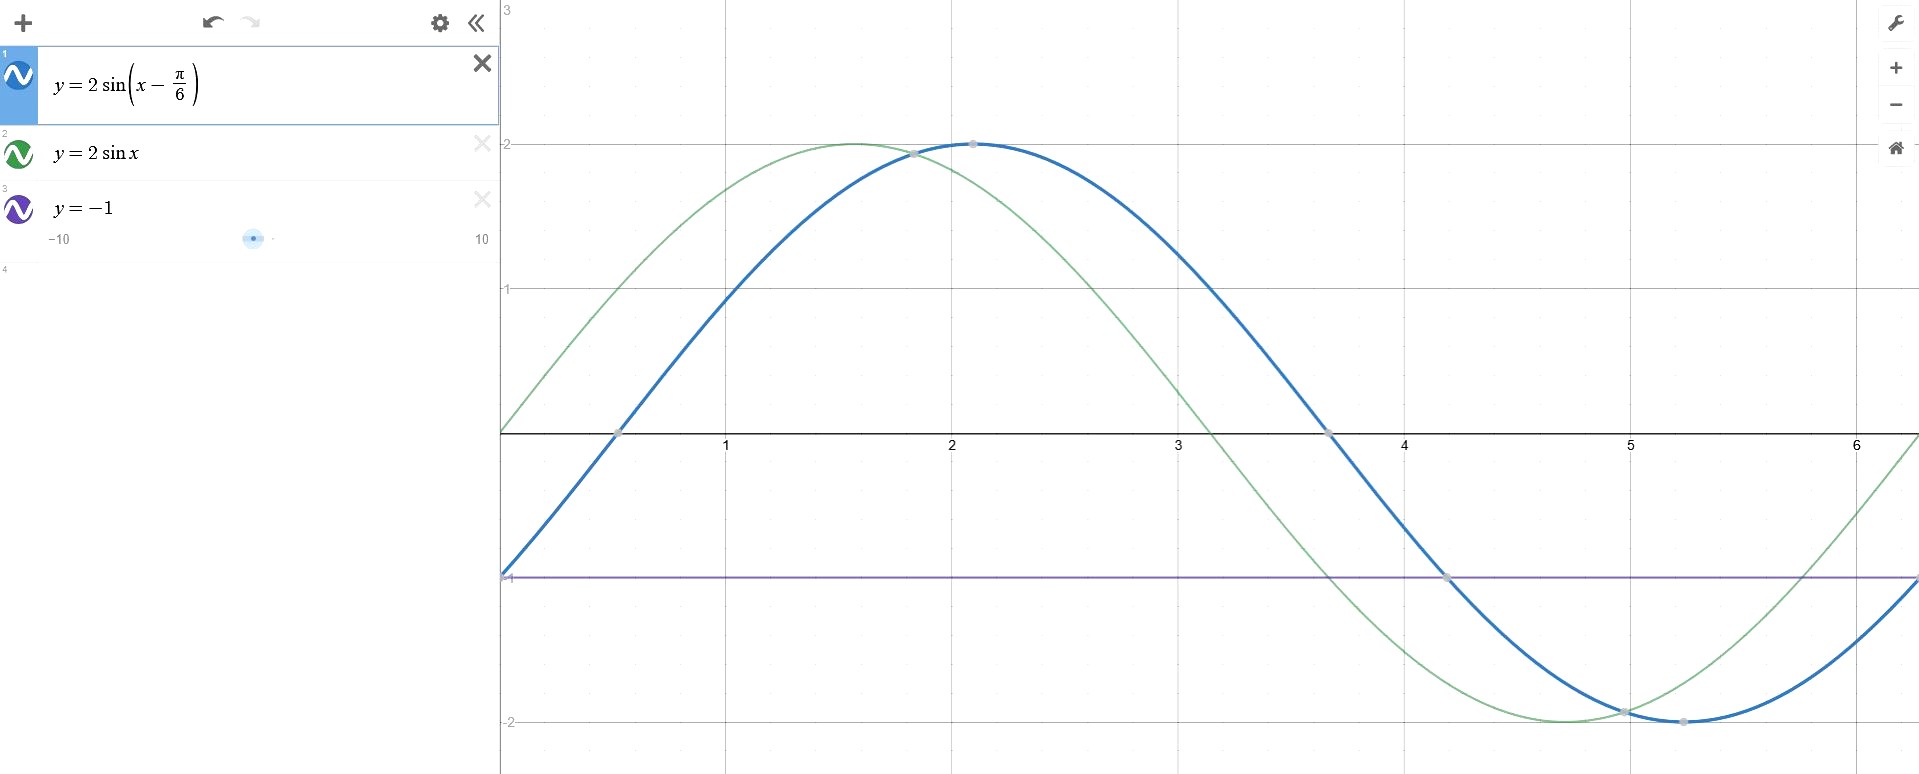
The blue graph represents our function y = 2 sin (x - pi/6) while the green graph represents the function y = 2 sin x. As we can see, the blue graph is pi/6 units to the right of the green graph. This is easily evident in the movement of the turning points.
The intersection of the blue graph and the horizontal line represents the intersection which we actually need. The region where 2 sin (x - pi/6) <= -1 can be found from the picture. We only need to find the two intersection values to describe our required range of values of x.
The intersection of the blue graph and the horizontal line represents the intersection which we actually need. The region where 2 sin (x - pi/6) <= -1 can be found from the picture. We only need to find the two intersection values to describe our required range of values of x.
Date Posted:
4 years ago
done
{{ upvoteCount }} Upvotes
clear
{{ downvoteCount * -1 }} Downvotes
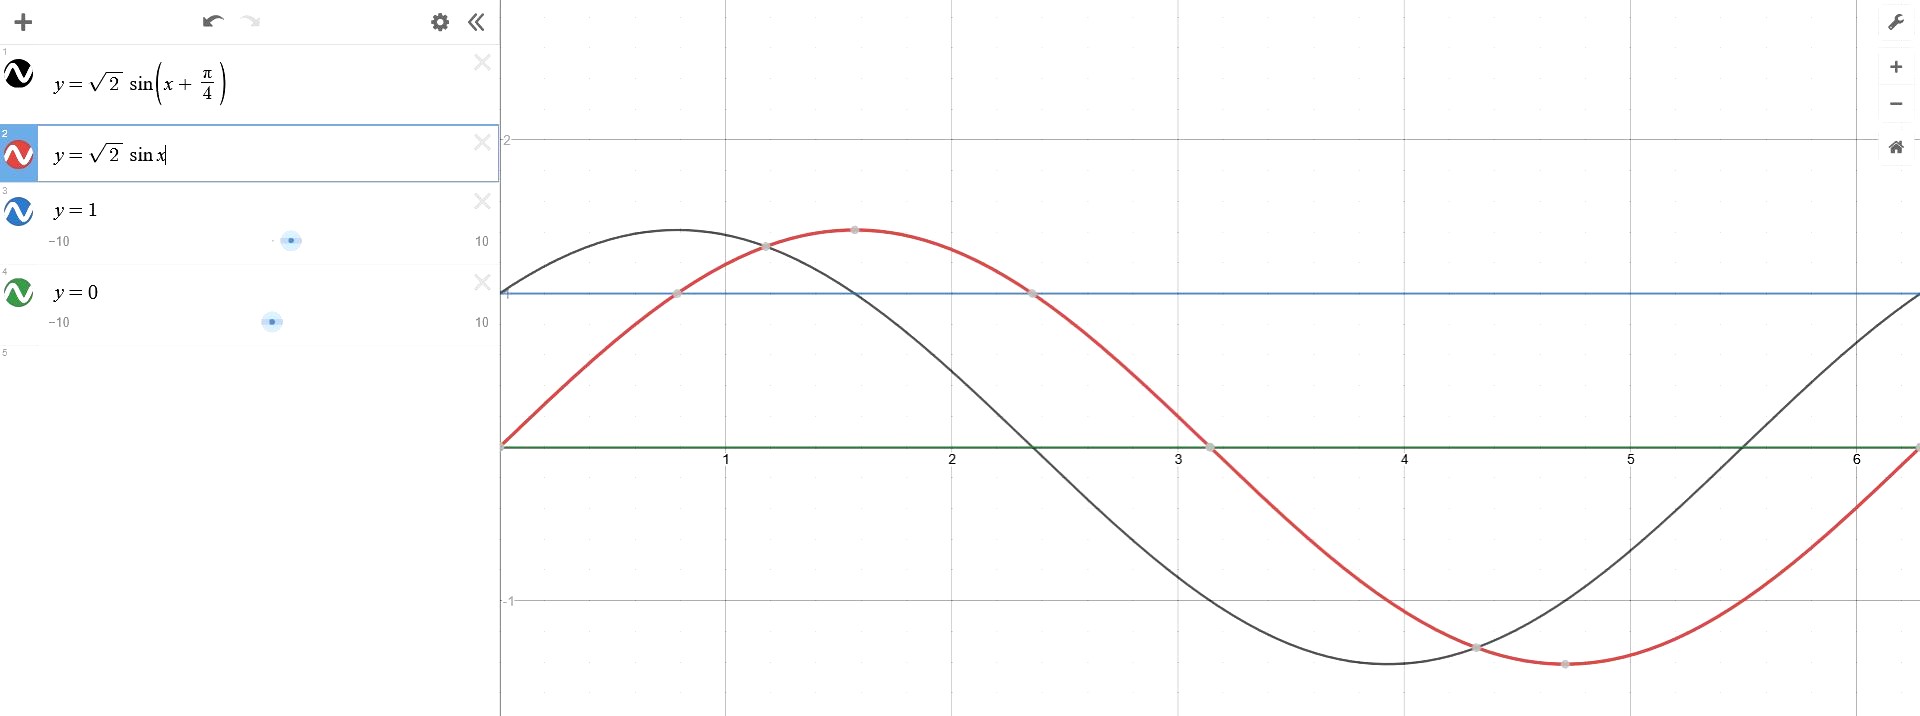
The black graph represents our function y = (sqrt 2) * sin (x + pi/4) while the red graph represents the function y = (sqrt 2) * sin x. As we can see, the black graph is pi/6 units to the left of the red graph. This is easily evident in the movement of the turning points.
The intersection of the black graph and the two horizontal lines represents the intersection which we actually need. We are looking for portions of the graph which lie between the line y = 1 and the x-axis.
The intersection of the black graph and the two horizontal lines represents the intersection which we actually need. We are looking for portions of the graph which lie between the line y = 1 and the x-axis.
Date Posted:
4 years ago