Eric Nicholas K's answer to genevieve's Secondary 4 A Maths Singapore question.
done
{{ upvoteCount }} Upvotes
clear
{{ downvoteCount * -1 }} Downvotes

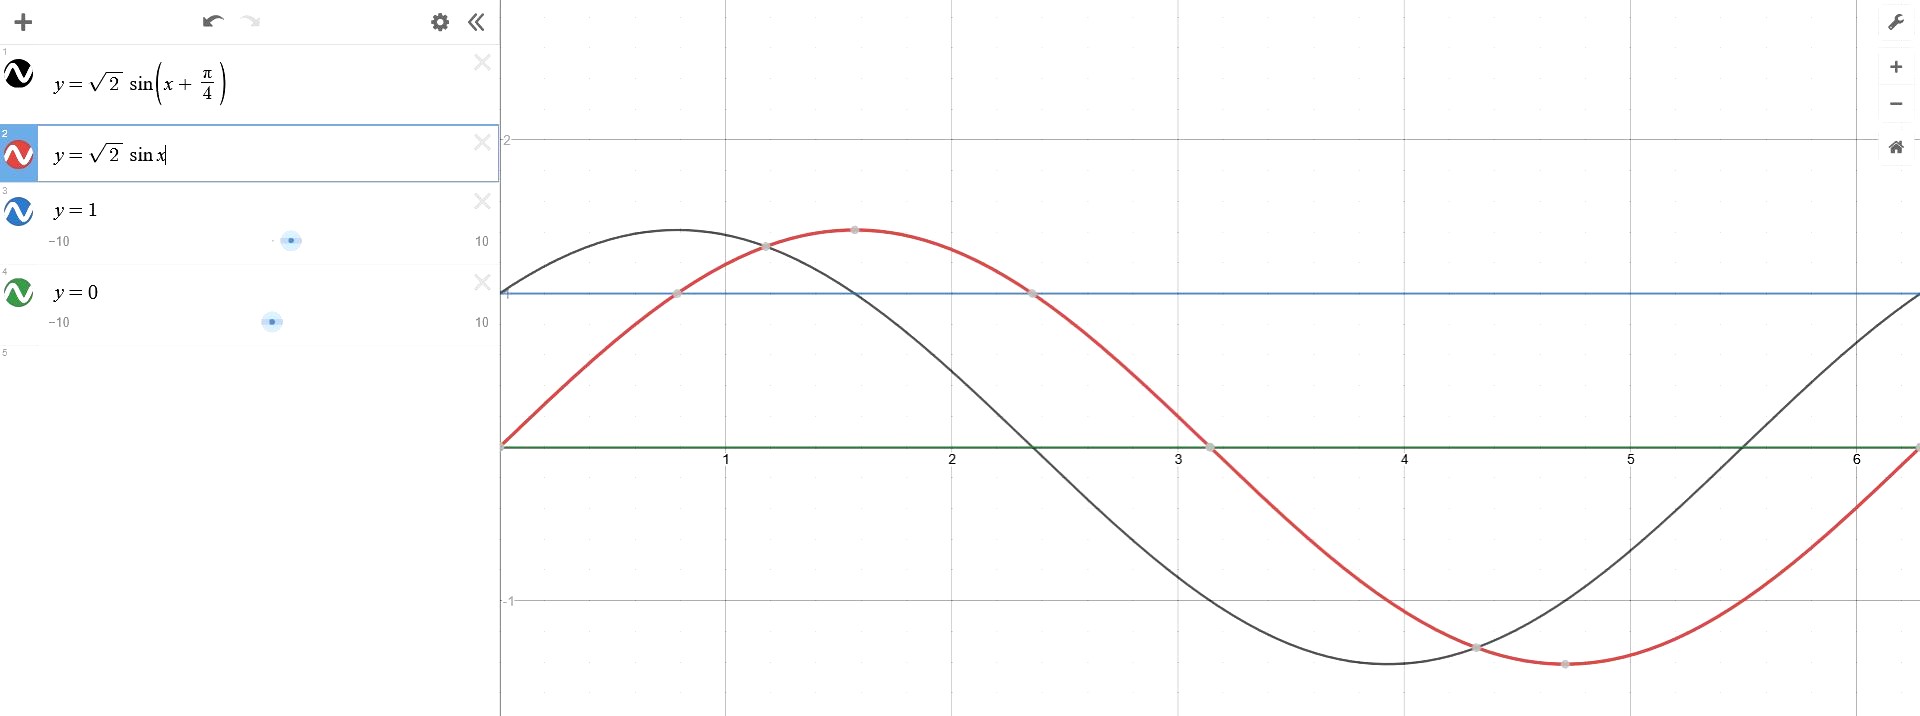
The black graph represents our function y = (sqrt 2) * sin (x + pi/4) while the red graph represents the function y = (sqrt 2) * sin x. As we can see, the black graph is pi/6 units to the left of the red graph. This is easily evident in the movement of the turning points.
The intersection of the black graph and the two horizontal lines represents the intersection which we actually need. We are looking for portions of the graph which lie between the line y = 1 and the x-axis.
The intersection of the black graph and the two horizontal lines represents the intersection which we actually need. We are looking for portions of the graph which lie between the line y = 1 and the x-axis.
Date Posted:
4 years ago
