Eric Nicholas K's answer to genevieve's Secondary 4 A Maths Singapore question.
done
{{ upvoteCount }} Upvotes
clear
{{ downvoteCount * -1 }} Downvotes

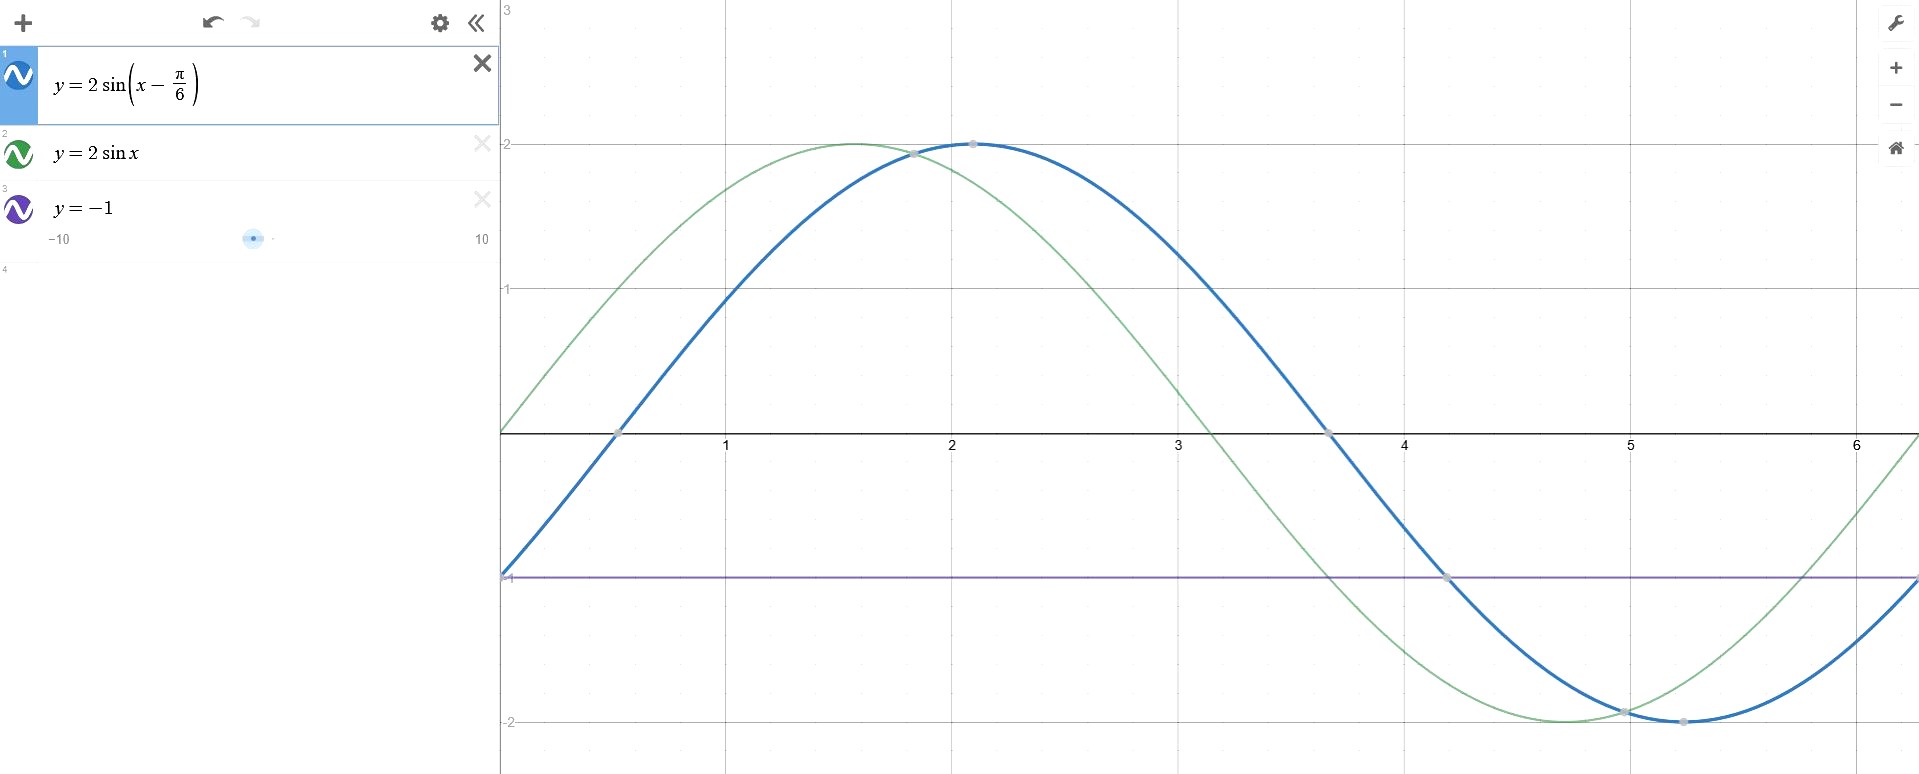
The blue graph represents our function y = 2 sin (x - pi/6) while the green graph represents the function y = 2 sin x. As we can see, the blue graph is pi/6 units to the right of the green graph. This is easily evident in the movement of the turning points.
The intersection of the blue graph and the horizontal line represents the intersection which we actually need. The region where 2 sin (x - pi/6) <= -1 can be found from the picture. We only need to find the two intersection values to describe our required range of values of x.
The intersection of the blue graph and the horizontal line represents the intersection which we actually need. The region where 2 sin (x - pi/6) <= -1 can be found from the picture. We only need to find the two intersection values to describe our required range of values of x.
Date Posted:
4 years ago
