Eric Nicholas K's answer to Vignesh anand's Secondary 3 A Maths Singapore question.
done
{{ upvoteCount }} Upvotes
clear
{{ downvoteCount * -1 }} Downvotes

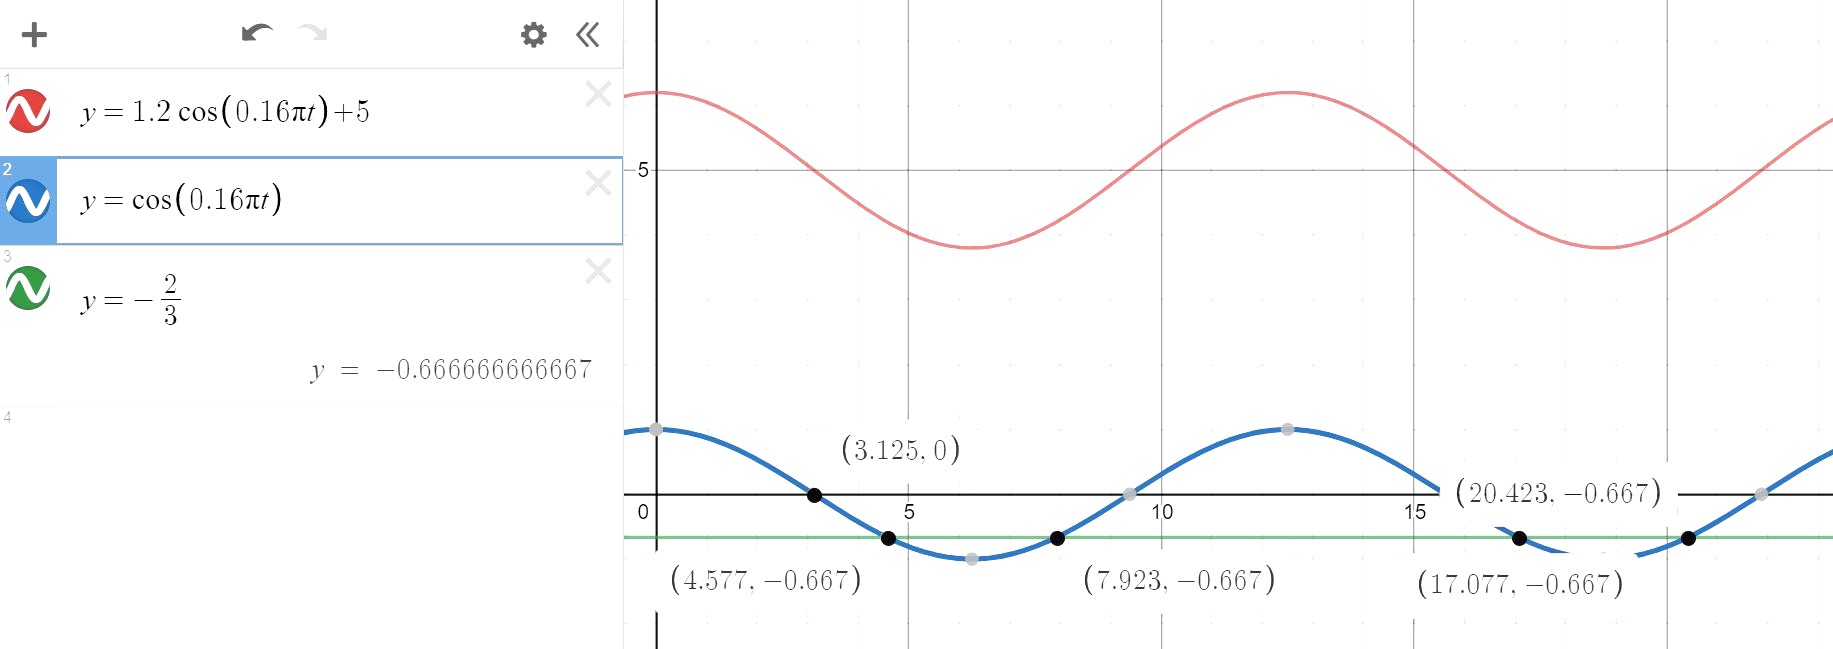
This graph supplements the text I sent you in the main chat box.
The red graph is the original equation and we need to find the range of values of t for which h > 4.2.
The blue graph is the equivalent equation and we need to find the range of values of t for which the graph is above the green line y = -2/3.
The red graph is the original equation and we need to find the range of values of t for which h > 4.2.
The blue graph is the equivalent equation and we need to find the range of values of t for which the graph is above the green line y = -2/3.
Date Posted:
3 years ago

Thank u so much Mr Eric. Truly appreciate your help!
