Ask Singapore Homework?
Upload a photo of a Singapore homework and someone will email you the solution for free.

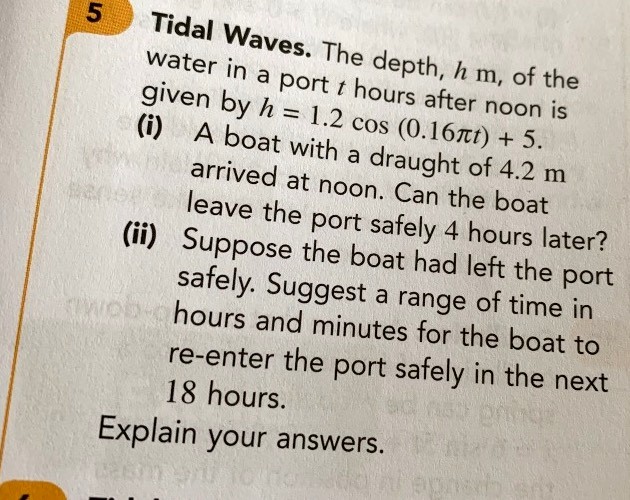
Question
secondary 3 | A Maths
One Answer Below
Anyone can contribute an answer, even non-tutors.

Pls help Mr. Eric. Thanks
Date Posted: 3 years ago
Views: 218

Let me understand the terminologies of the ship because I am not familiar with them.
(i)
Initial value of h
= 1.2 cos 0 + 5
= 1.2 + 5
= 6.2 m
So, the depth of water is 6.2 m when the ship arrives at noon. The draught is 4.2 m.
According to what I found, draught is the minimum depth of water that a ship can safely navigate. So, if h < 4.2 m, the ship should not start the navigation for safety reasons.
When t = 4,
h = (just sub t = 4 inside the equation in radian)
= 4.48906485
~ 4.49 m
So, the depth of water is 4.49 m, and this is above the draught value of 4.2 m. So, the ship can leave the port safely.
We are looking for values of t between 4 < t <= 22.
For the boat to re-enter the port safely,
h >= 4.2
1.2 cos (0.16pi t) + 5 >= 4.2
1.2 cos (0.16pi t) >= -0.8
cos (0.16pi t) >= -2/3
If we draw the graph of cos (0.16pi t) for values of t from 4 to 22, we need to pick the parts of the graph above the horizontal line y = -2/3. This graph will be used only for the purposes of the inequality range later on.
Suppose cos (0.16pi t) = -2/3 (rather than >=).
Basic angle, alpha = 0.8410686706
0.16pi t = 2nd quad, 3rd quad, 2nd quad next cycle, 3rd quad next cycle,...
0.16pi t = pi - alpha, pi + alpha, 3pi - alpha, 3pi + alpha, ...
0.16pi t = 2.300523983, 3.982661324, 8.58370929, 10.26584663, ...
t = 4.576747045, 7.923252955, 17.07674704, 20.42325296, ...
These will be solutions to the equation cos (0.16pi t) = -2/3. Now, we use the graph to decide on which portions of the graph to take. This is similar in methodology to how we do quadratic inequalities, but this time using sinusoidal graphs instead of quadratic graphs.
Using the graph, we find that the inequalities to meet, within the range 4 to 22, are
4 < t <= 4.57
7.92 <= t <= 17.1
20.4 <= t <= 22
I will send you the Desmos graph soon.
Thanks a lot. These qns r modeling of trigonometry in real world. It’s new syllabus from this year. I have done working based on your guidance. Will post it. Let me know if my understanding is ok
See 1 Answer
done
{{ upvoteCount }} Upvotes
clear
{{ downvoteCount * -1 }} Downvotes
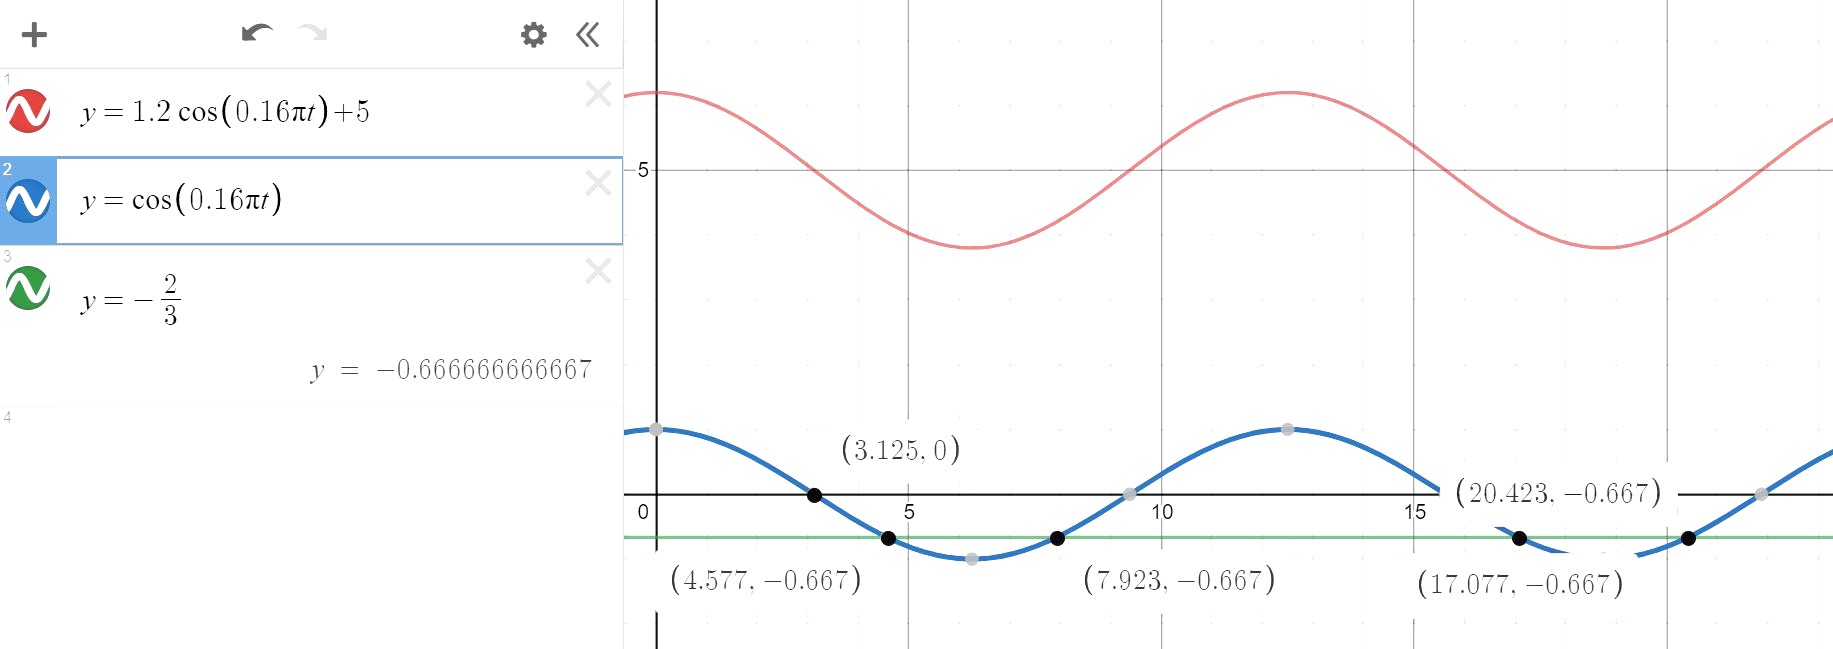
This graph supplements the text I sent you in the main chat box.
The red graph is the original equation and we need to find the range of values of t for which h > 4.2.
The blue graph is the equivalent equation and we need to find the range of values of t for which the graph is above the green line y = -2/3.
The red graph is the original equation and we need to find the range of values of t for which h > 4.2.
The blue graph is the equivalent equation and we need to find the range of values of t for which the graph is above the green line y = -2/3.
Date Posted:
3 years ago
Thank u so much Mr Eric. Truly appreciate your help!