 360 Tutoring Program
*If you qualify, the Free 360 Tutoring Program will be extended to you at no extra charge.
On top of the tutor you are getting, ManyTutors will provide unlimited free tutors to help you with any questions you may have for other subjects. Just snap a photo of your homework, post, and someone will provide the solution for free.
You will get a complimentary premium account on Ask ManyTutors that allows you to ask English, Chinese, Malay, Math, Science, Geography and History homework questions free of charge.
Under the 360 Program, the tutor will receive a different rate from what you are paying to ManyTutors.


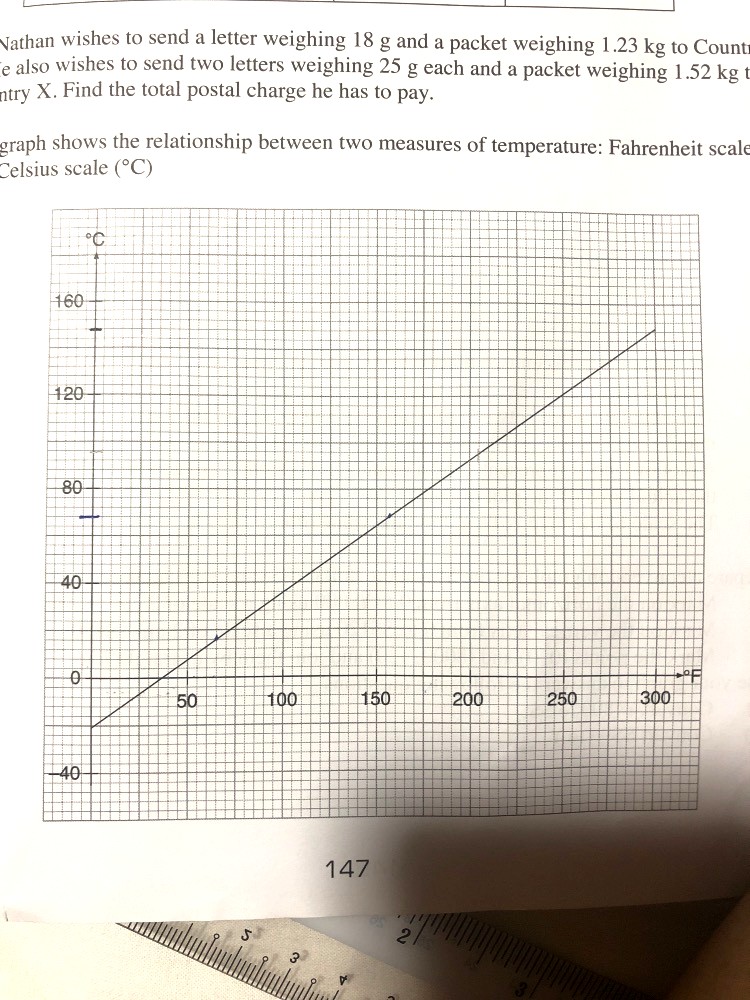
q is the Celsius intercept of the graph, which is a temperature of -20.
So, q is -20.
p represents the gradient of the graph in this case.
Using (0, -20) and (100, 36) here,
p = [36 - (-20)] divided by (100 - 0)
p = 0.56