Eric Nicholas K's answer to Ria's Secondary 3 E Maths Singapore question.
done
{{ upvoteCount }} Upvotes
clear
{{ downvoteCount * -1 }} Downvotes

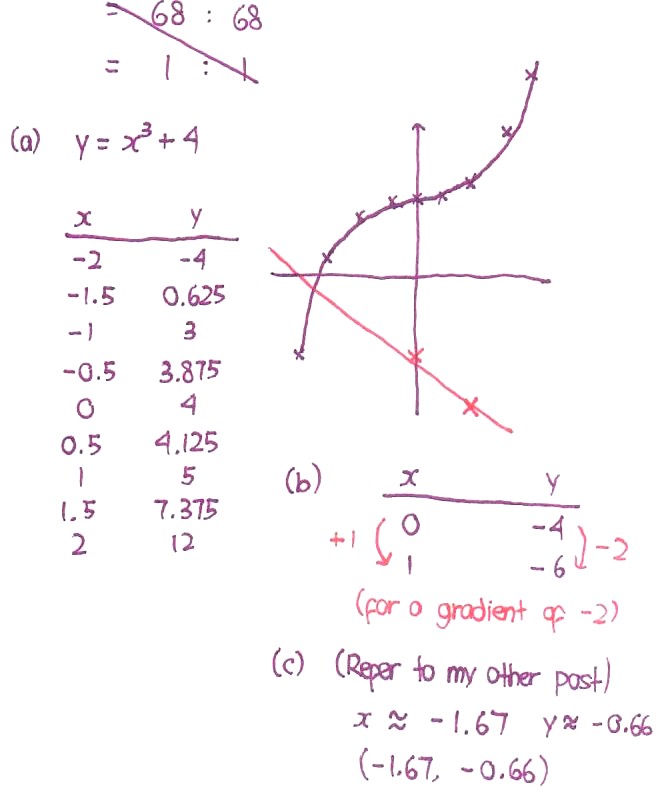
Follow my guidelines for the drawing of the graph.
1. You will need to construct a table of values of x and y for the graph, in x-intervals of 0.5.
2. Once done, calculate the respective values of y.
3. Plot the points on the graph and draw a graph to fit it, following the curvature of the points.
For part ii, we do likewise. For a line of gradient -2, this means that for every +1 in the value of x, there is a -2 in the value of y. We plot two points (sufficient for a line) and join them with a straight line.
Up next is a more accurate sketch of the graphs from Desmos. Refer to this post for the graph.
Date Posted:
4 years ago
