Ask Singapore Homework?
Upload a photo of a Singapore homework and someone will email you the solution for free.

Question
secondary 3 | E Maths
2 Answers Below
Anyone can contribute an answer, even non-tutors.

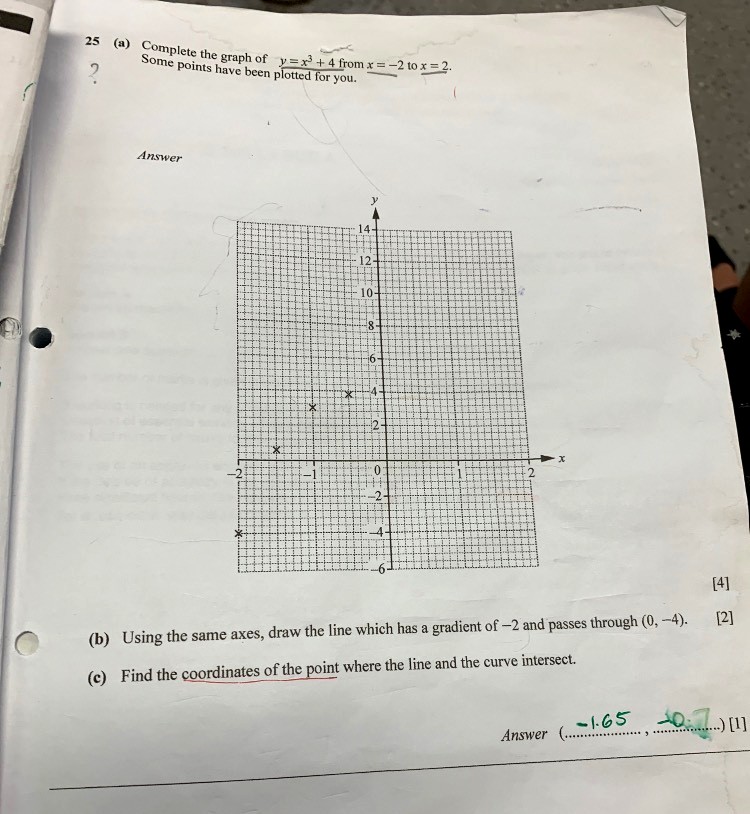
Really need help with this thanksss!!
Date Posted: 4 years ago
Views: 370

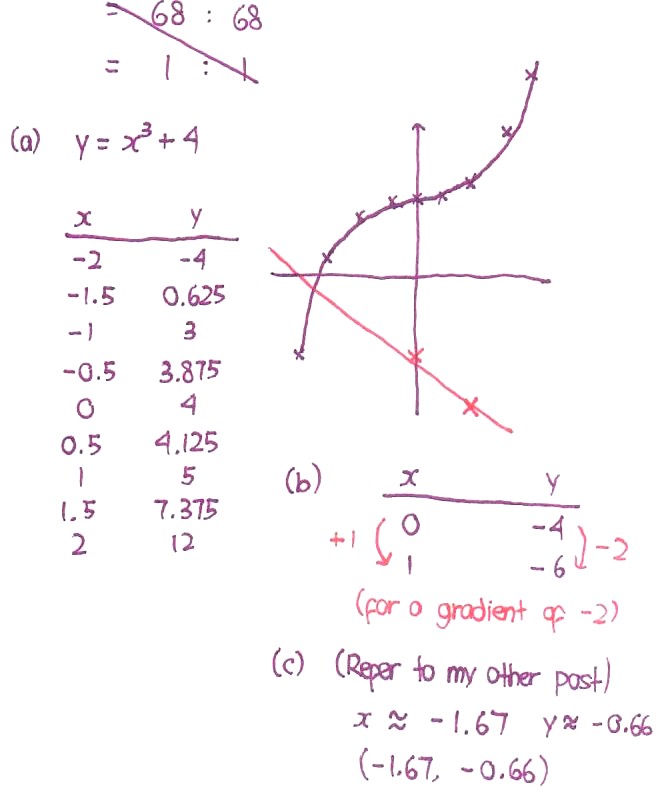
The easiest for part a is to plot a series of values for x and y.
When x = -2, y = -4.
When x = -1.5, y = ...
Do this in intervals of 0.5 for x until x = 2, y = 12 and mark the points out on the graph. We then proceed to sketch the graph.
For part b, a gradient of -2 means that for every +1 change in the x value, there is a -2 change in the y value.
When x = 0, y = -4 (for the line)
When x = 1, y = -6.
We connect these two points on the graph together and join them by a straight line. Extend this line from both sides until the line intersects the curve.
See 2 Answers
done
{{ upvoteCount }} Upvotes
clear
{{ downvoteCount * -1 }} Downvotes
Follow my guidelines for the drawing of the graph.
1. You will need to construct a table of values of x and y for the graph, in x-intervals of 0.5.
2. Once done, calculate the respective values of y.
3. Plot the points on the graph and draw a graph to fit it, following the curvature of the points.
For part ii, we do likewise. For a line of gradient -2, this means that for every +1 in the value of x, there is a -2 in the value of y. We plot two points (sufficient for a line) and join them with a straight line.
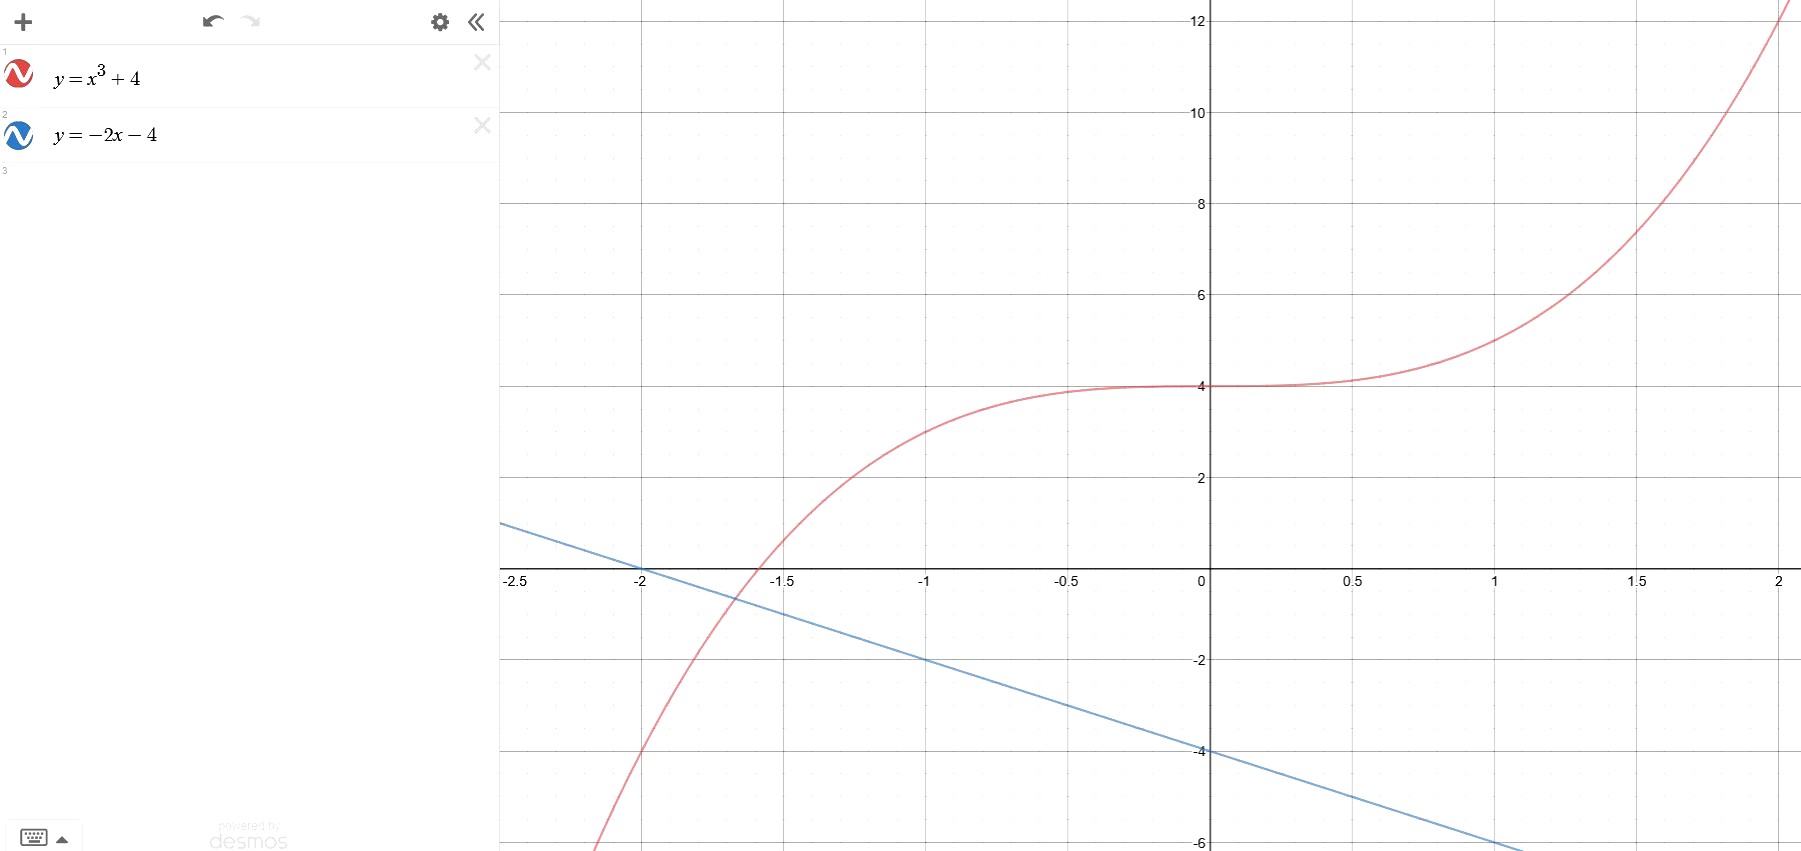
Up next is a more accurate sketch of the graphs from Desmos. Refer to this post for the graph.
1. You will need to construct a table of values of x and y for the graph, in x-intervals of 0.5.
2. Once done, calculate the respective values of y.
3. Plot the points on the graph and draw a graph to fit it, following the curvature of the points.
For part ii, we do likewise. For a line of gradient -2, this means that for every +1 in the value of x, there is a -2 in the value of y. We plot two points (sufficient for a line) and join them with a straight line.
Up next is a more accurate sketch of the graphs from Desmos. Refer to this post for the graph.
Date Posted:
4 years ago
done
{{ upvoteCount }} Upvotes
clear
{{ downvoteCount * -1 }} Downvotes
Here
Date Posted:
4 years ago