Eric Nicholas K's answer to Annela's Secondary 3 E Maths Singapore question.
done
{{ upvoteCount }} Upvotes
clear
{{ downvoteCount * -1 }} Downvotes

Good evening Annela! Here are my workings for Q19, which are very messy because I do not have a graph paper and I am not familiar of how to include a best fit curve online.
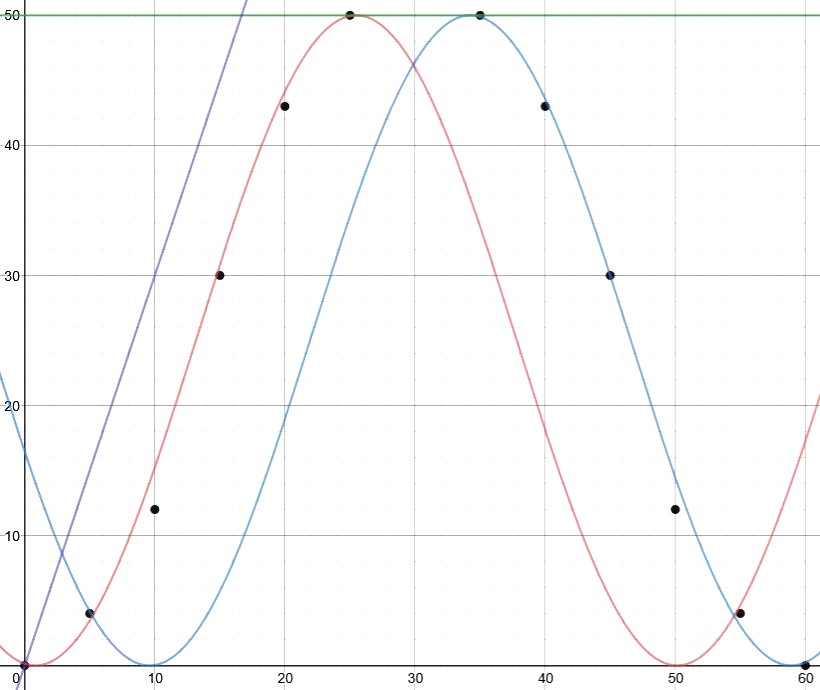
The coordinates are divided into two groups of six data points each. The red curve (upsloping from t = 0 s to t = 25 s) fits the first six data points. The blue curve (downsloping from t = 35 s to t = 60 s) fits the last six data points. The green horizontal line at h = 50 m represents the period of time (t = 25 s to t = 35 s) when the load is at rest. The other parts of the curves are unimportant for this question.
The gradient of the graph is approximately 3.00 (represented by the purple line), and this represents the speed of the load at the particular instant (3 m/s when t = 16 s).
Date Posted:
4 years ago
