Ask Singapore Homework?
Upload a photo of a Singapore homework and someone will email you the solution for free.


Question
secondary 3 | E Maths
4 Answers Below
Anyone can contribute an answer, even non-tutors.

Can someone show me how to do qns 17,18,19 and 20 ? Thanks
Date Posted: 4 years ago
Views: 450
See 4 Answers
done
{{ upvoteCount }} Upvotes
clear
{{ downvoteCount * -1 }} Downvotes

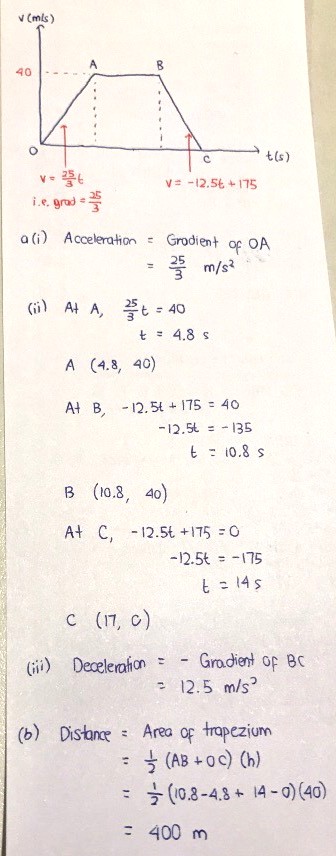
Good evening Annela! Here are my workings for this question.
Date Posted:
4 years ago
Will look at the rest another time
done
{{ upvoteCount }} Upvotes
clear
{{ downvoteCount * -1 }} Downvotes
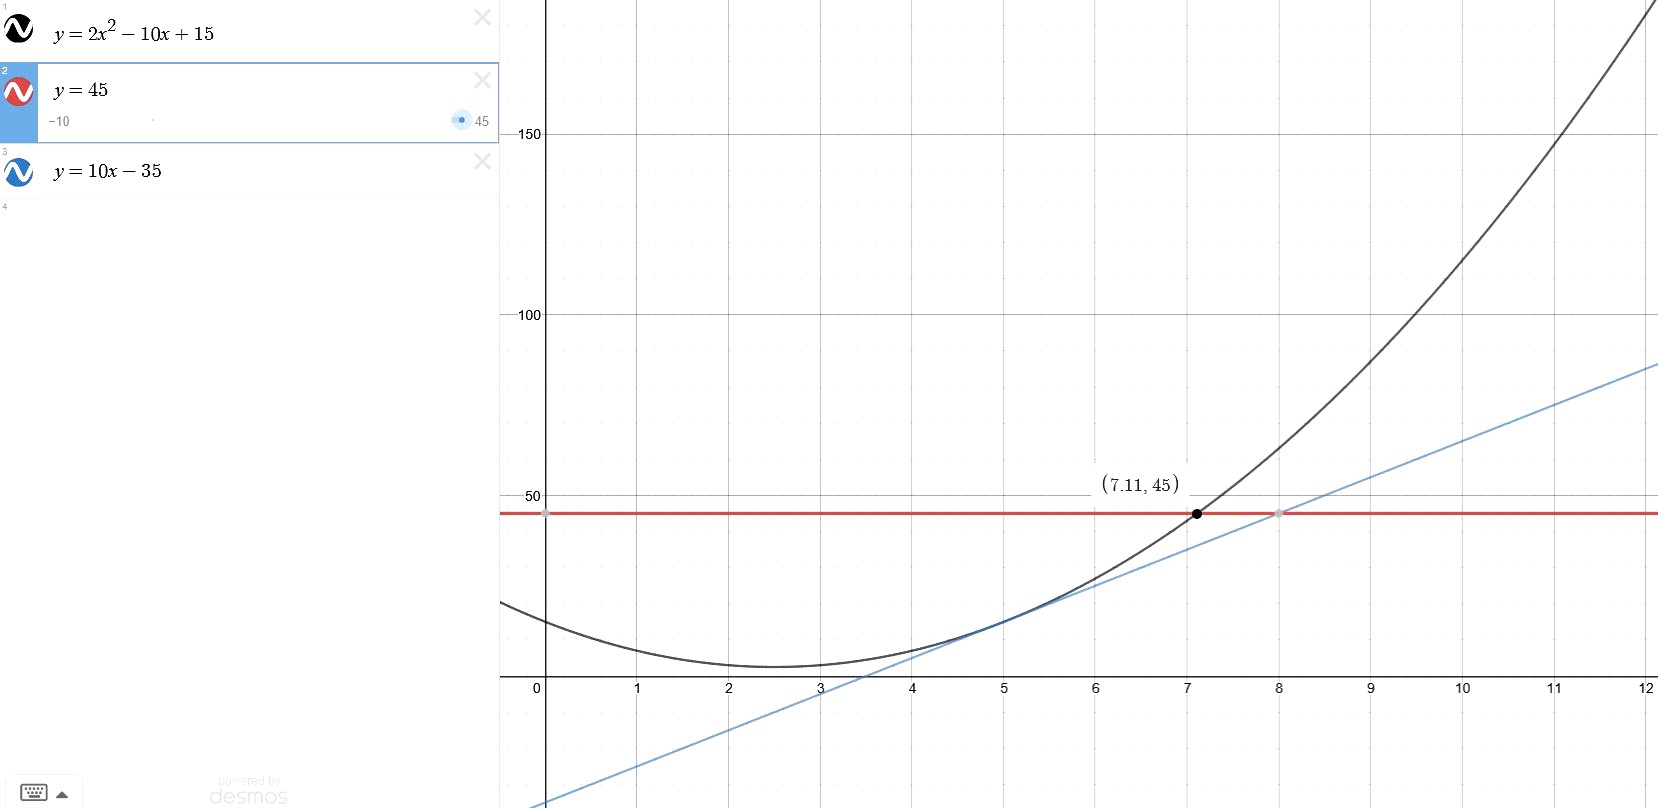
Good evening Annela!
Here is the relevant graph for Q18.
(a) Value of a is 7 and value of b is 115.
(b) Drawn but not using the scale since the scale cannot be set here.
(c) (i) When v = 45 m/s, t ~ 7.11 s.
(c) (ii) By drawing a tangent, the gradient of the graph is 10. This gradient with value 10 means that the particle is moving with an acceleration of 10 m/s2.
Date Posted:
4 years ago
done
{{ upvoteCount }} Upvotes
clear
{{ downvoteCount * -1 }} Downvotes
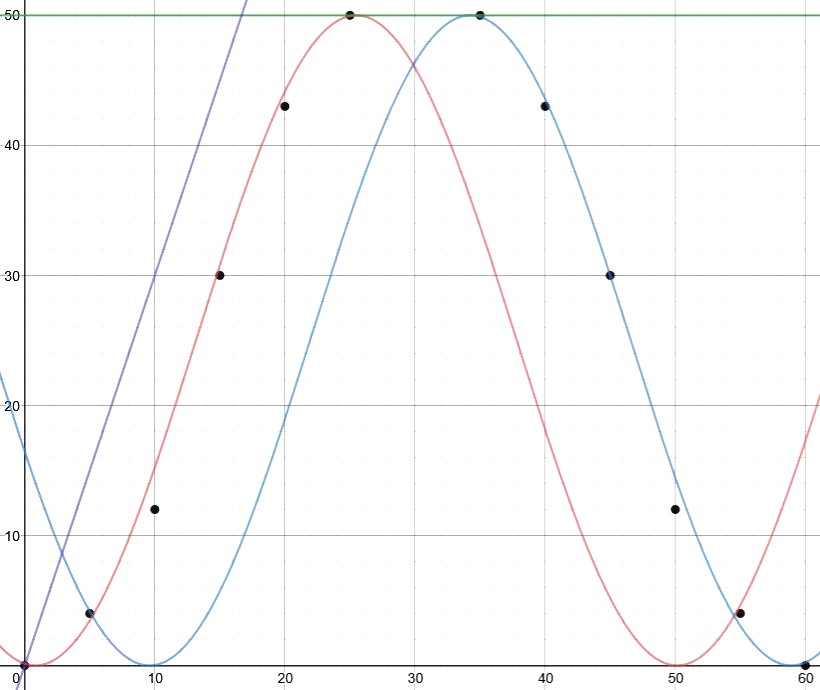
Good evening Annela! Here are my workings for Q19, which are very messy because I do not have a graph paper and I am not familiar of how to include a best fit curve online.
The coordinates are divided into two groups of six data points each. The red curve (upsloping from t = 0 s to t = 25 s) fits the first six data points. The blue curve (downsloping from t = 35 s to t = 60 s) fits the last six data points. The green horizontal line at h = 50 m represents the period of time (t = 25 s to t = 35 s) when the load is at rest. The other parts of the curves are unimportant for this question.
The gradient of the graph is approximately 3.00 (represented by the purple line), and this represents the speed of the load at the particular instant (3 m/s when t = 16 s).
Date Posted:
4 years ago
done
{{ upvoteCount }} Upvotes
clear
{{ downvoteCount * -1 }} Downvotes
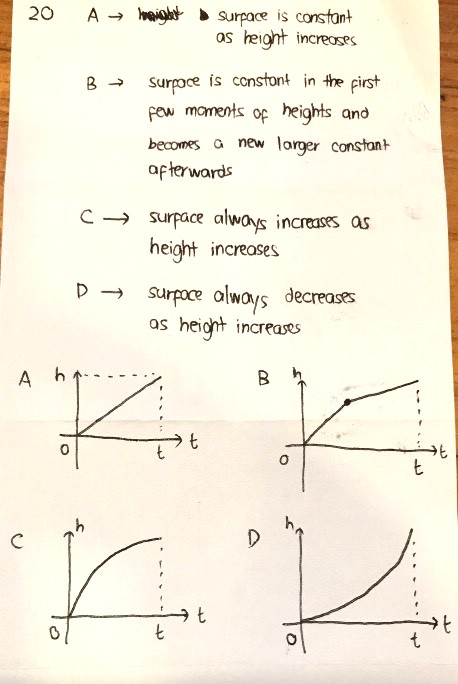
Good evening Annela! Here are my workings for Q20. I will now move on to your trigo question. The graph one I skip for now.
Date Posted:
4 years ago