Eric Nicholas K's answer to Annela's Secondary 4 Chemistry Singapore question.
done
{{ upvoteCount }} Upvotes
clear
{{ downvoteCount * -1 }} Downvotes

Good evening Annela! Here are my workings for Q8. At any point in time if you do not understand my workings, let me know and I will do my best to explain them to you again!
Date Posted:
4 years ago

Hello i dont understand why Y is for result II because III also has the same volume (50cm^3)
Good evening Annela! I’m so sorry I just read your reply, which did not get into my notification. Will look at my solutions again.
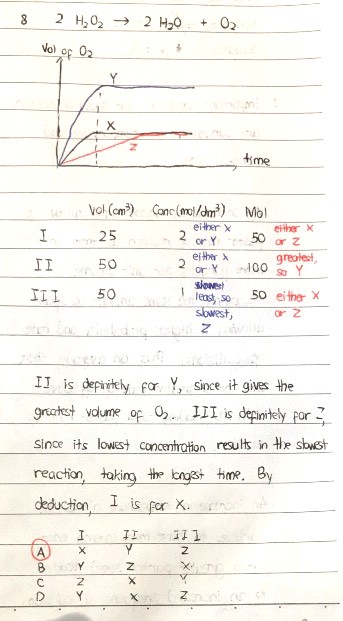
In the case of I, II and III (the chemicals used), the volume of II and the volume of III used is exactly the same at 50 cm3. However, the concentration is different, where II is 2 mol/dm3 and III is 1 mol/dm3.
A consequence of this is that solution II contains 50/1000 x 2 = 0.1 mol of H2O2 while solution III contains 50/1000 x 1 = 0.05 mol of H2O2. Clearly solution II has twice as much H2O2 as solution III. As a result, solution II will liberate twice as much oxygen gas (from the decomposition reaction) as solution III.
So in this case, we cannot say that having the same volume of H2O2 results in graphs of the same height, simply because the amount of contents dissolved in the same volume of liquid is not the same in those cases; in fact, the graph is only directly related to the number of moles of O2 formed. The more the number of moles of H2O2 decomposed, the more the number of moles of O2 generated and hence the more the volume of O2 generated. This translates to a higher final position in the graph.
If we observe the axes carefully, the vertical axis represents the volume of O2 generated, which is directly proportional to the number of moles of O2 generated (and of course the number of moles of H2O2 decomposed). As a result, solution II should result in a graph that reaches a maximum height which is twice that of solution III.
Hence, graph Y corresponds to solution II.
Between X and Z, the slower one, which is Z, must have come from the solution with the lowest concentration, which is solution III.
That leaves graph X for solution I.
