Eric Nicholas K's answer to Elaine's Junior College 1 H2 Maths Singapore question.
done
1 Upvotes
clear -1 Downvotes

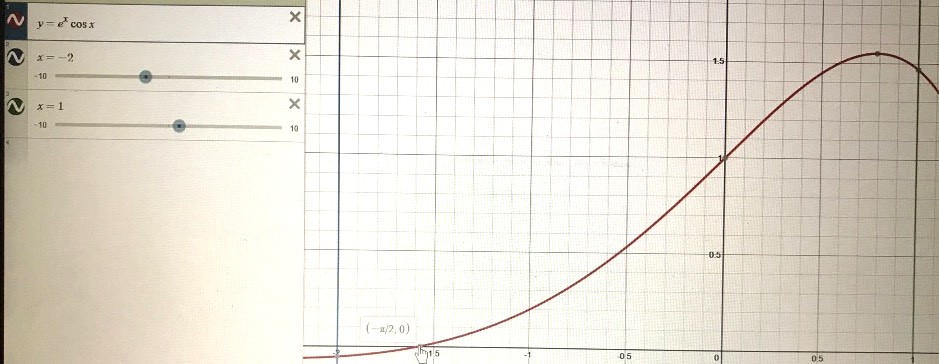
Here is the relevant sketch of the graph using Desmos. In that interval, the coordinates of the intercepts are (-pi/2, 0) for the x-intercept and (0, 1) for the y-intercept. The vertical blue and green lines are the boundary conditions for the curve.
Date Posted:
5 years ago
