Eric Nicholas K's answer to Chelsia's Secondary 3 A Maths Singapore question.
done
{{ upvoteCount }} Upvotes
clear
{{ downvoteCount * -1 }} Downvotes

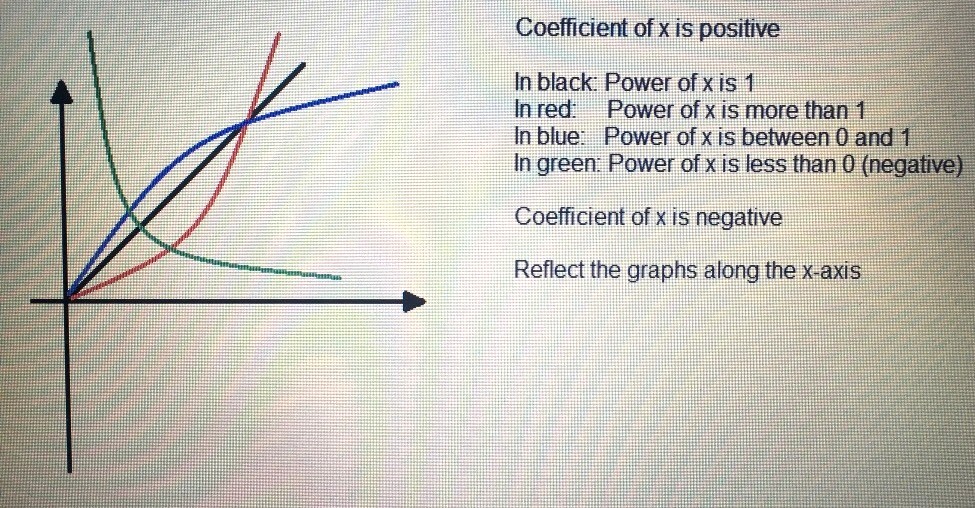
Here are the general shapes of the graphs for positive coefficients of x.
If the power of x is 1, the graph is linear (this is in E Maths, but I put this for comparison purposes).
If the power of x is more than 1, the graph starts slow first but then suddenly curves upwards very quickly. This is because as x increases, y increases rapidly (think of y = x2).
Similar logic applies for power of x from 0 to 1. The graph starts moderately fast at first but then slows down. This is because as x increases, y no longer increases by much.
For the last case where the power of x is negative, the graph goes down in the manner I have drawn. This is because as x increases, y decreases, yet the value of y can never be negative. As x increases, t decreases but the rate of decrease slows down (think of y = 1/x from E Maths).
Let me know if you need more explanation on this and I will do my best to explain again.
Date Posted:
4 years ago
