Kelvin foo's answer to Rosy's Primary 4 Maths question.
done
{{ upvoteCount }} Upvotes
clear
{{ downvoteCount * -1 }} Downvotes

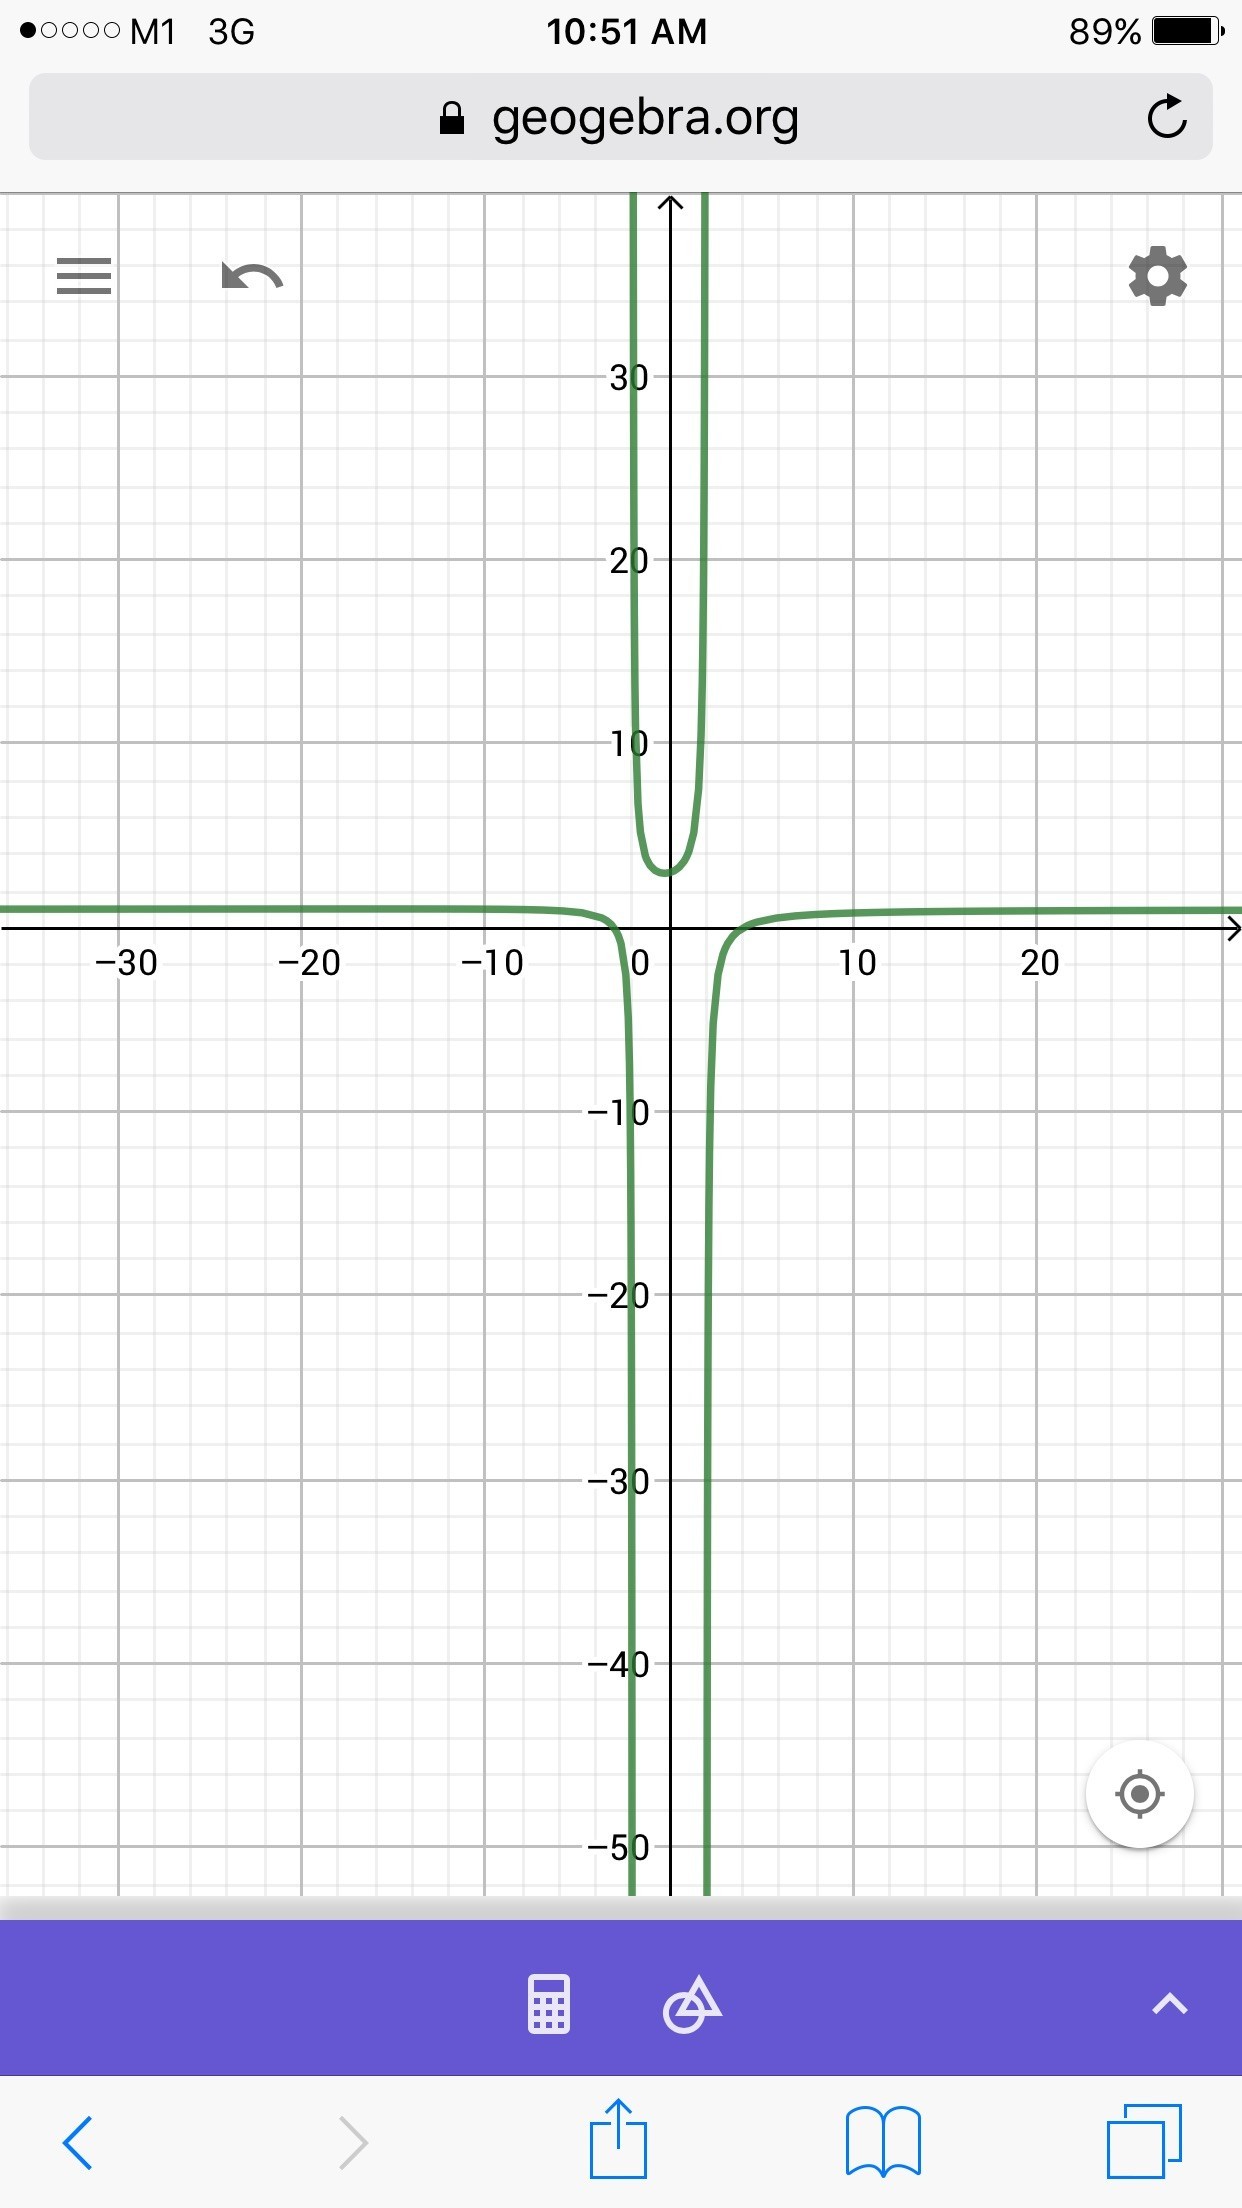
Since there is no actual y value for the range, the graph is unbounded.
By looking at the graph, the function is increasing at x=0 to x<2 ( do not include 2 since it is not in the domain as well as at x>2.
The function is decreasing at x<-2 (do not include -2 as it is not in the domain) and -2
By looking at the graph, the function is increasing at x=0 to x<2 ( do not include 2 since it is not in the domain as well as at x>2.
The function is decreasing at x<-2 (do not include -2 as it is not in the domain) and -2
Date Posted:
9 years ago

 360 Tutoring Program