Ask Singapore Homework?
Upload a photo of a Singapore homework and someone will email you the solution for free.

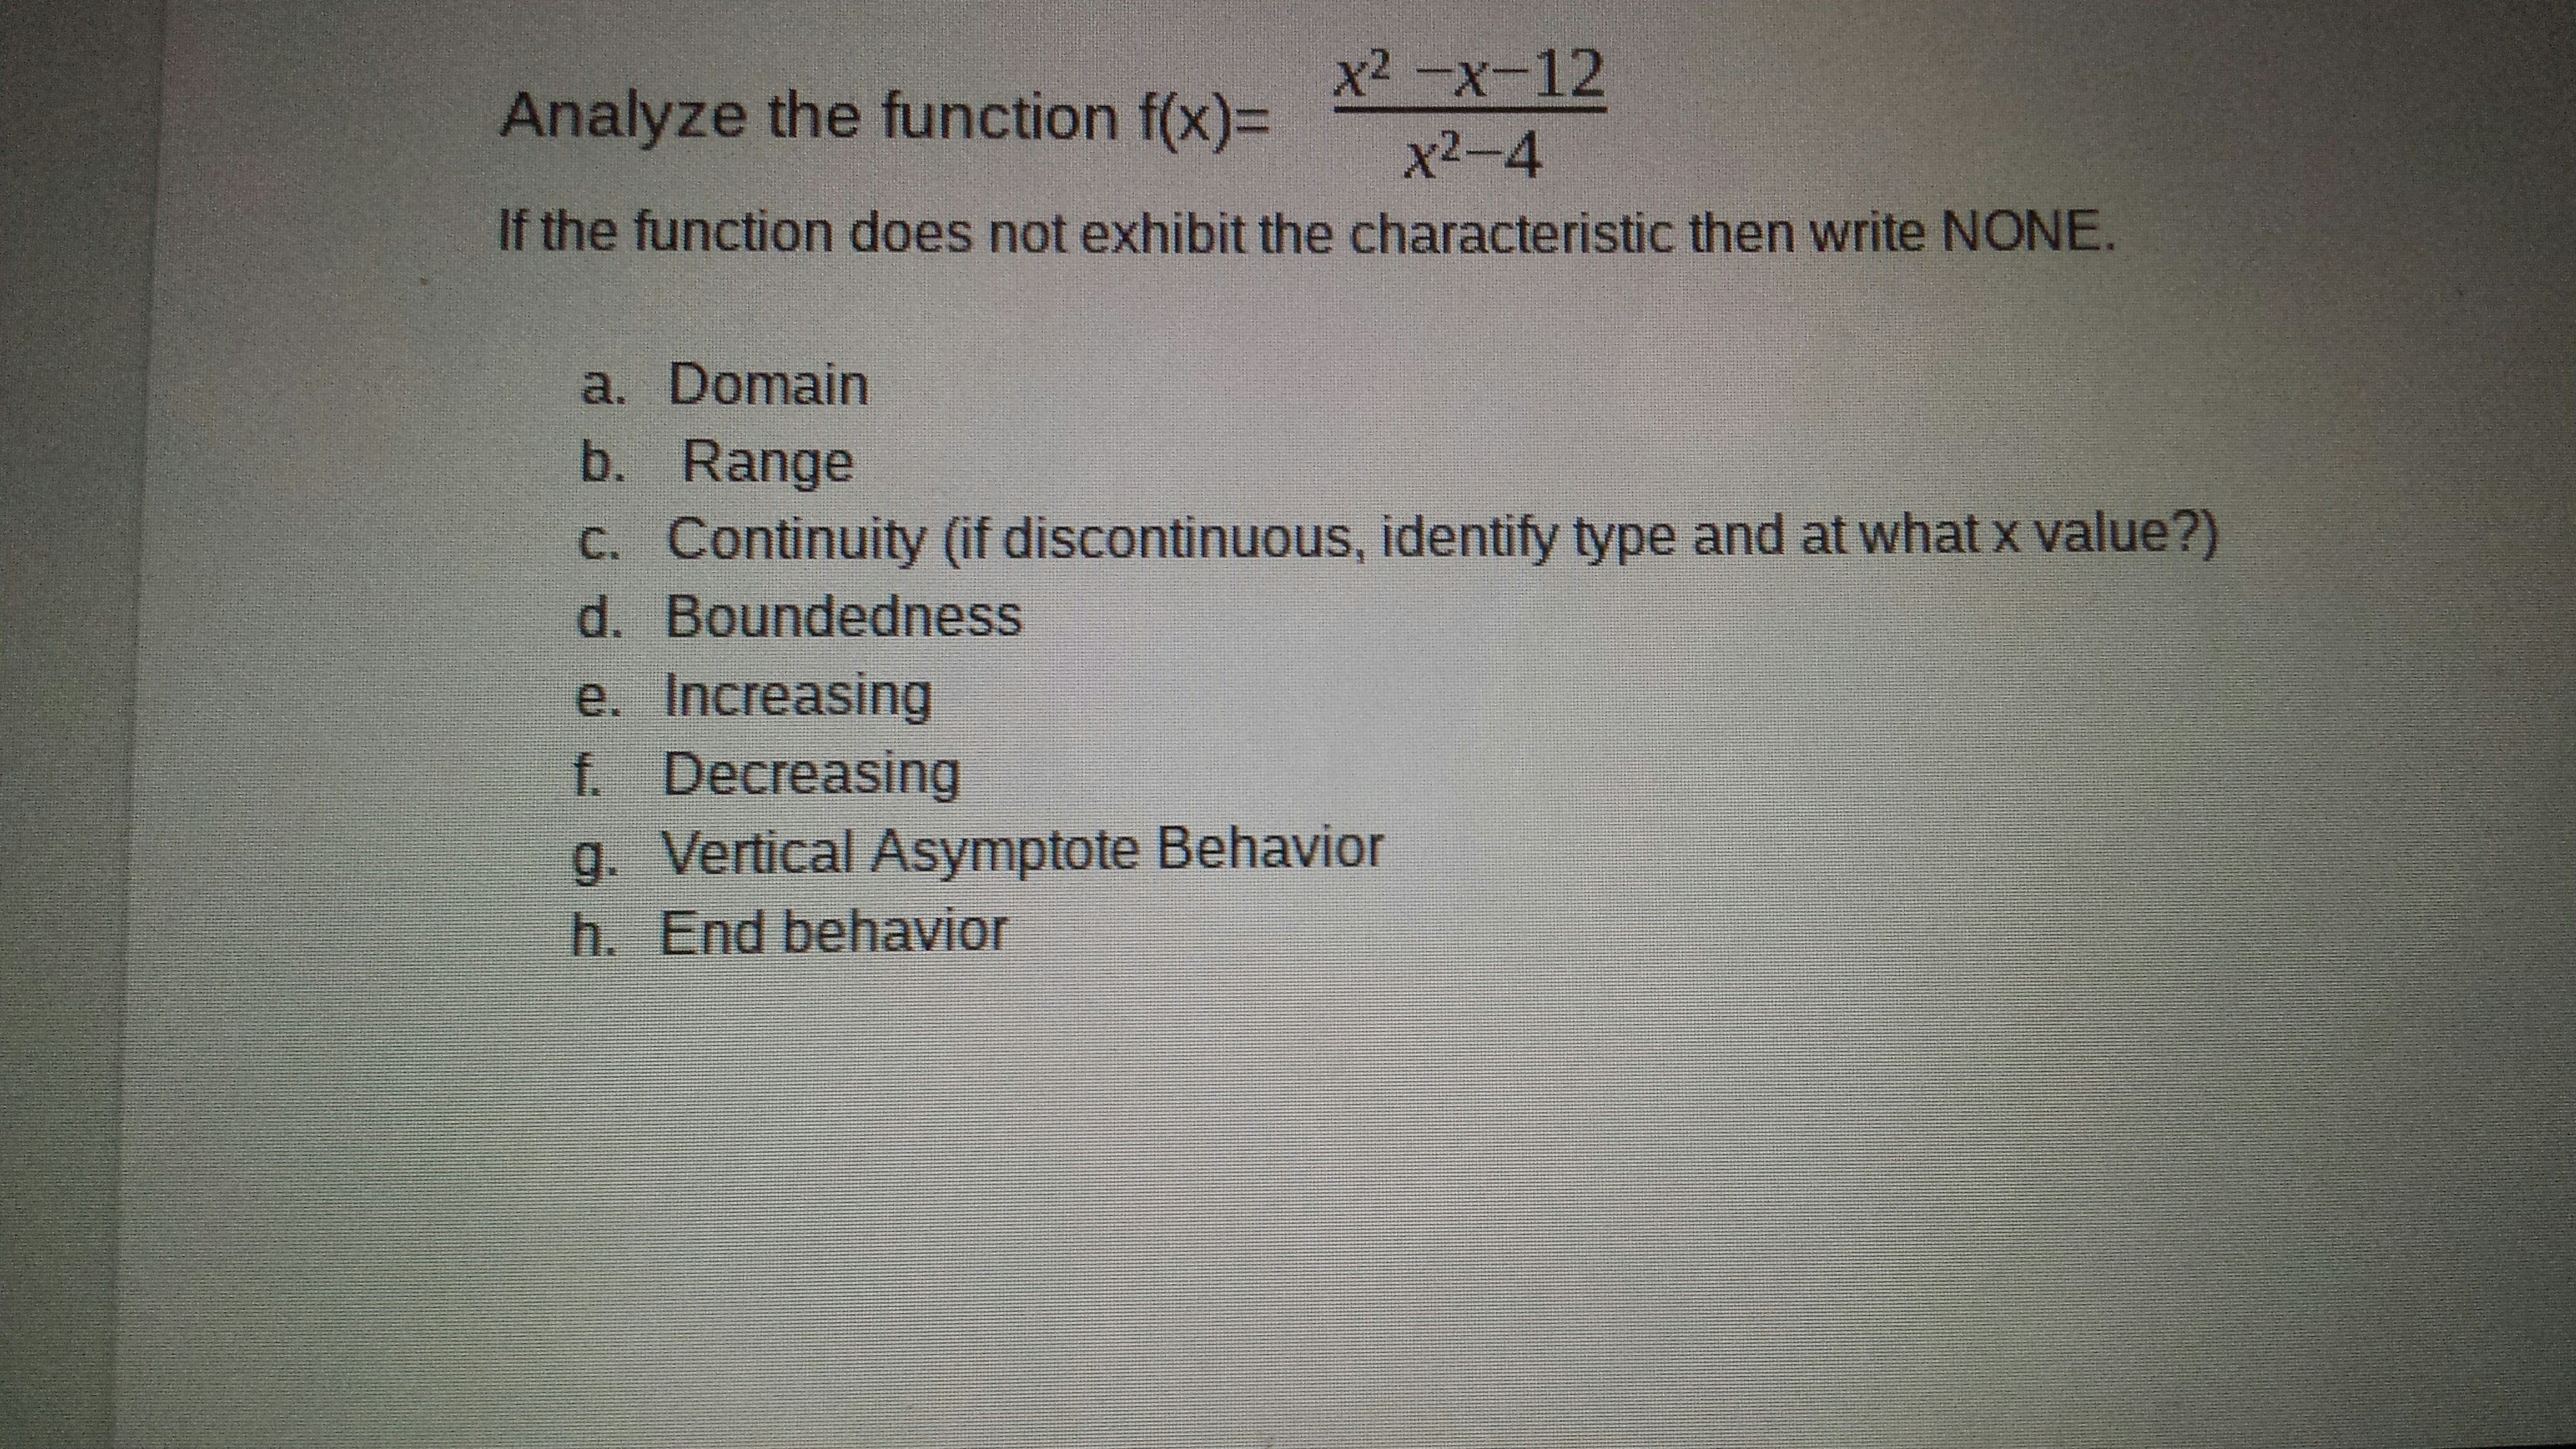
Question
Primary 4 | Maths
2 Answers Below
Anyone can contribute an answer, even non-tutors.

Please help answer all the parts.
And could u explain how you found the range and increasing/ decreasing .
If u can't explain it's OK.
Date Posted: 9 years ago
Views: 575
See 2 Answers
done
{{ upvoteCount }} Upvotes
clear
{{ downvoteCount * -1 }} Downvotes

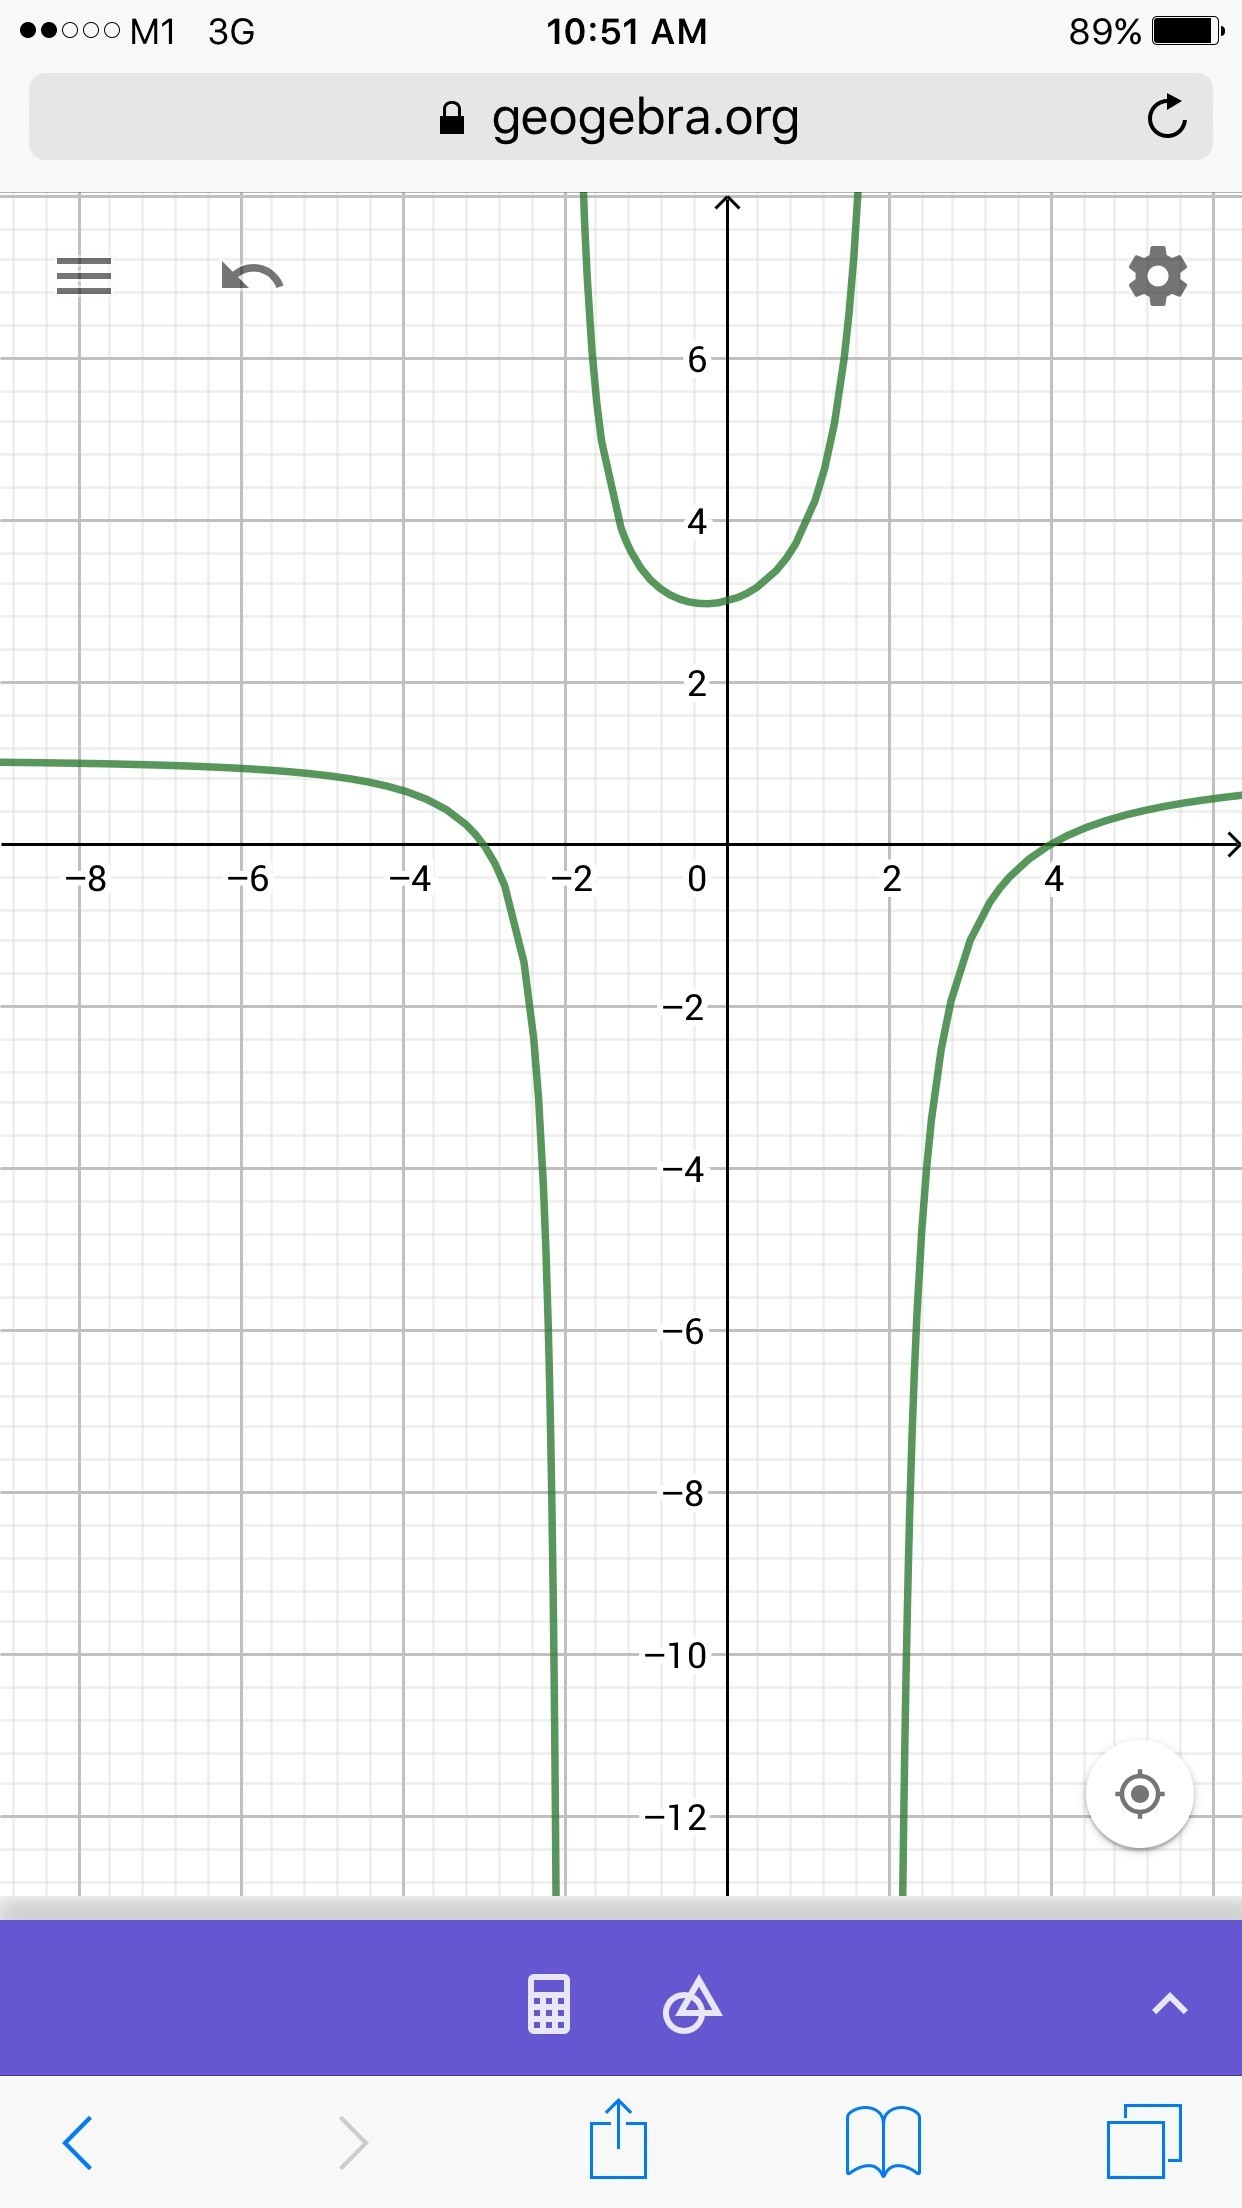
I will explain using the graph method.
(a) The domain exists for every x value that has a y value. Since x=2 and x=-2 has no y value (look at graph), the domain is every x value except for x=2 and x=-2. To find the domain that does not exist, make the denominator equal to zero and solve for x. The x values solved will not be in the domain.
Now to the behaviour of vertical asymptote, since x=2 and x=-2 are not in the domain, they are the vertical asymptotes. To find vertical asymptotes, use the same method as above just that the values found are the vertical asymptote. By looking at the graph, near x=2 and x=-2, the graph keeps decreasing and this is the behaviour of verticap asymptote behaviour.
By looking at the graph, the range is negative infinity to positive infinity.
By looking at the graph, there is no y value for x=2 and x=-2, and thus, the graph is discontinuous at x=2 and x=-2.
(a) The domain exists for every x value that has a y value. Since x=2 and x=-2 has no y value (look at graph), the domain is every x value except for x=2 and x=-2. To find the domain that does not exist, make the denominator equal to zero and solve for x. The x values solved will not be in the domain.
Now to the behaviour of vertical asymptote, since x=2 and x=-2 are not in the domain, they are the vertical asymptotes. To find vertical asymptotes, use the same method as above just that the values found are the vertical asymptote. By looking at the graph, near x=2 and x=-2, the graph keeps decreasing and this is the behaviour of verticap asymptote behaviour.
By looking at the graph, the range is negative infinity to positive infinity.
By looking at the graph, there is no y value for x=2 and x=-2, and thus, the graph is discontinuous at x=2 and x=-2.
Date Posted:
9 years ago
Can u answer the parts with mathematical things
Thank you put can u answer the parts
done
{{ upvoteCount }} Upvotes
clear
{{ downvoteCount * -1 }} Downvotes
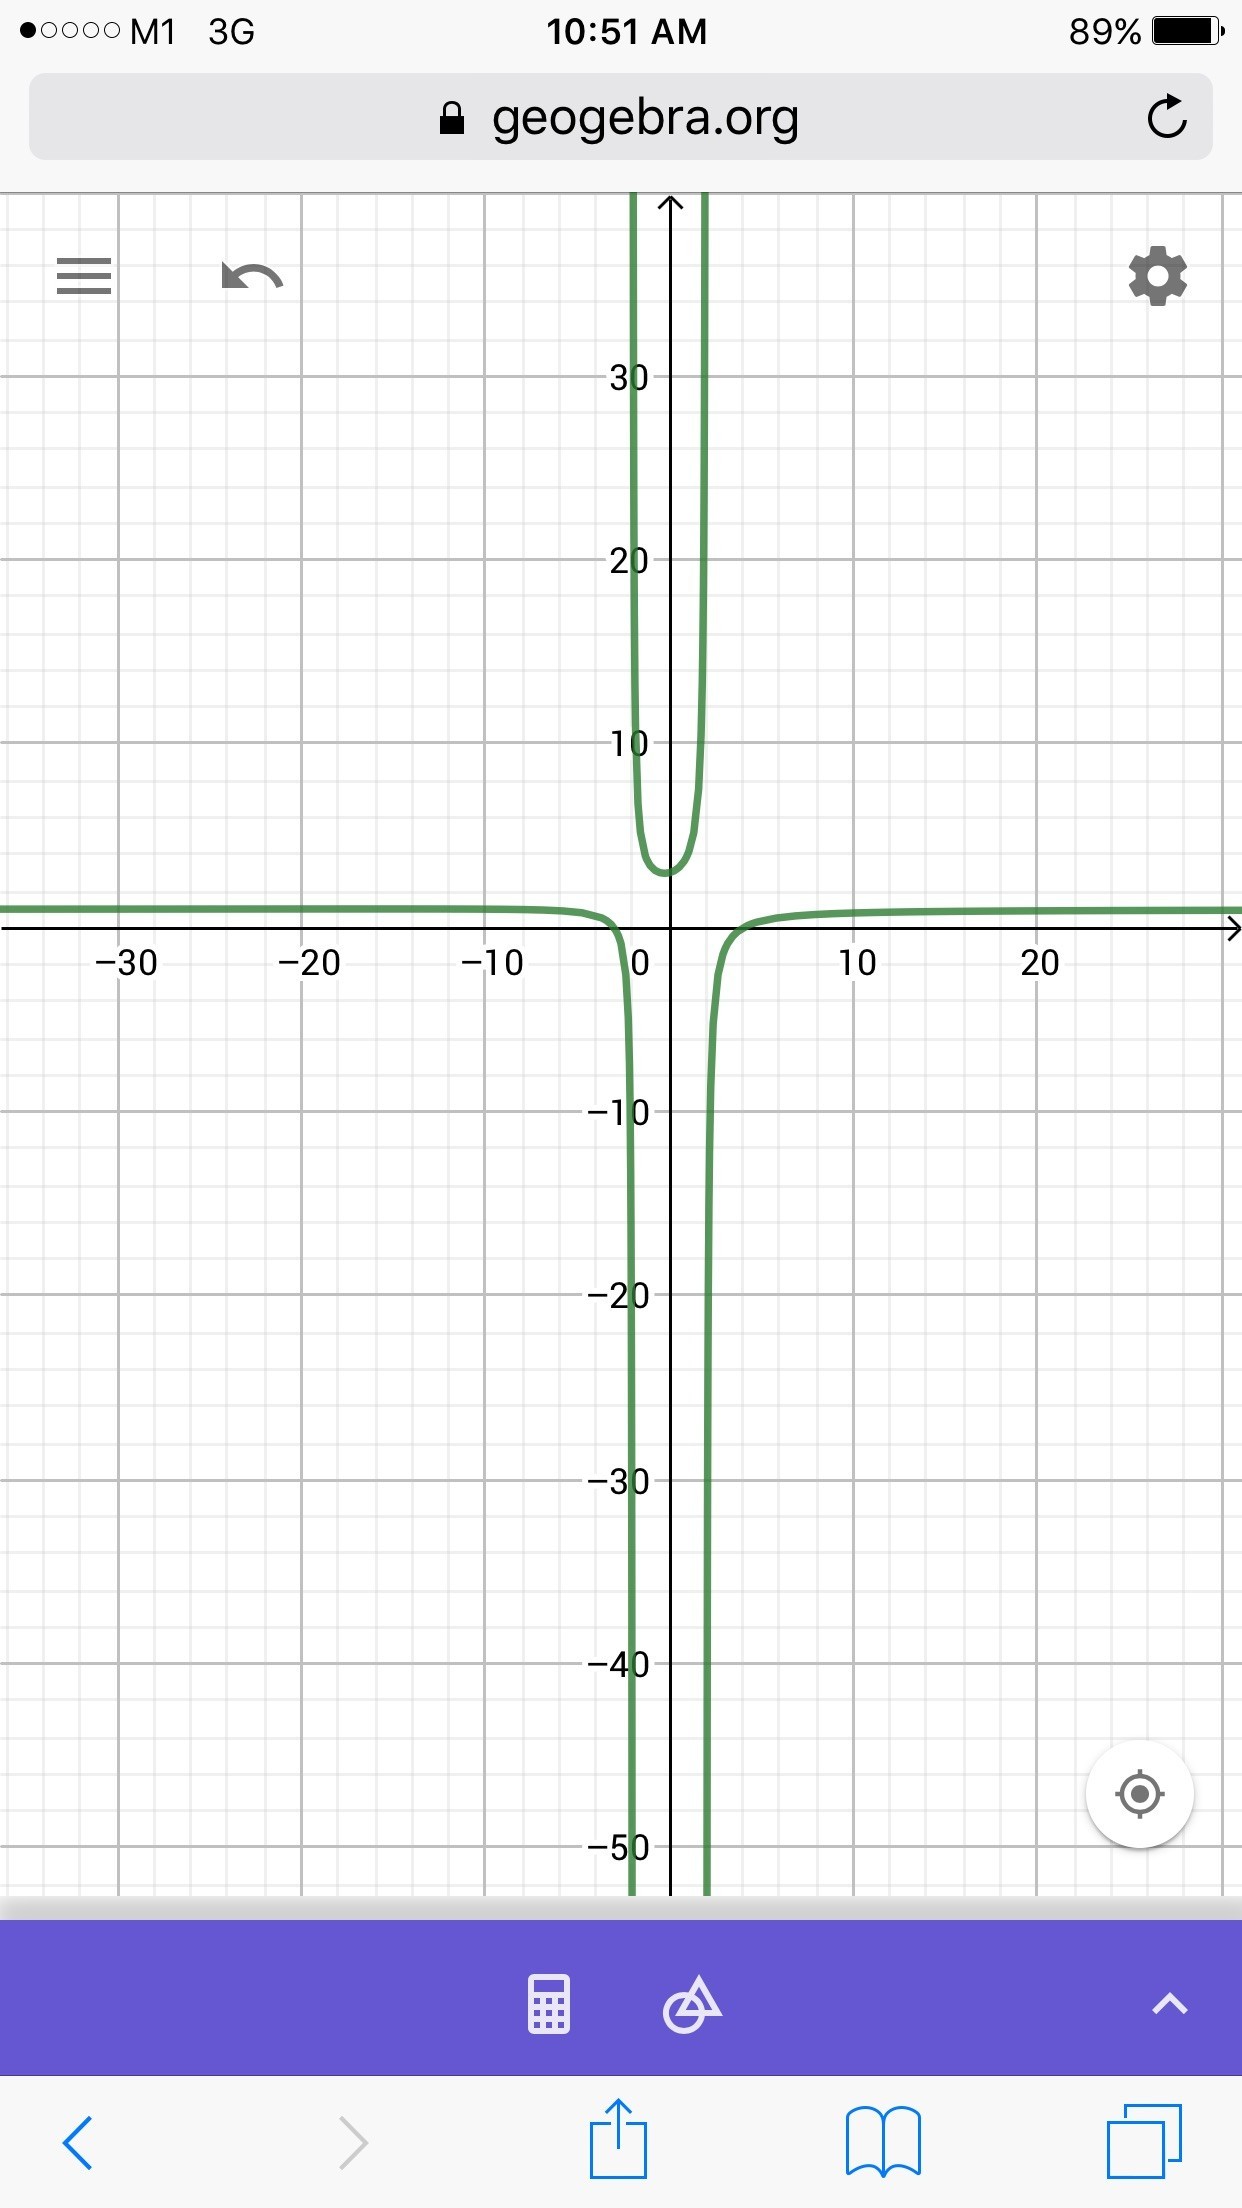
Since there is no actual y value for the range, the graph is unbounded.
By looking at the graph, the function is increasing at x=0 to x<2 ( do not include 2 since it is not in the domain as well as at x>2.
The function is decreasing at x<-2 (do not include -2 as it is not in the domain) and -2
By looking at the graph, the function is increasing at x=0 to x<2 ( do not include 2 since it is not in the domain as well as at x>2.
The function is decreasing at x<-2 (do not include -2 as it is not in the domain) and -2
Date Posted:
9 years ago


 360 Tutoring Program