Ivey's answer to Ivey's Secondary 3 A Maths Singapore question.
done
{{ upvoteCount }} Upvotes
clear
{{ downvoteCount * -1 }} Downvotes

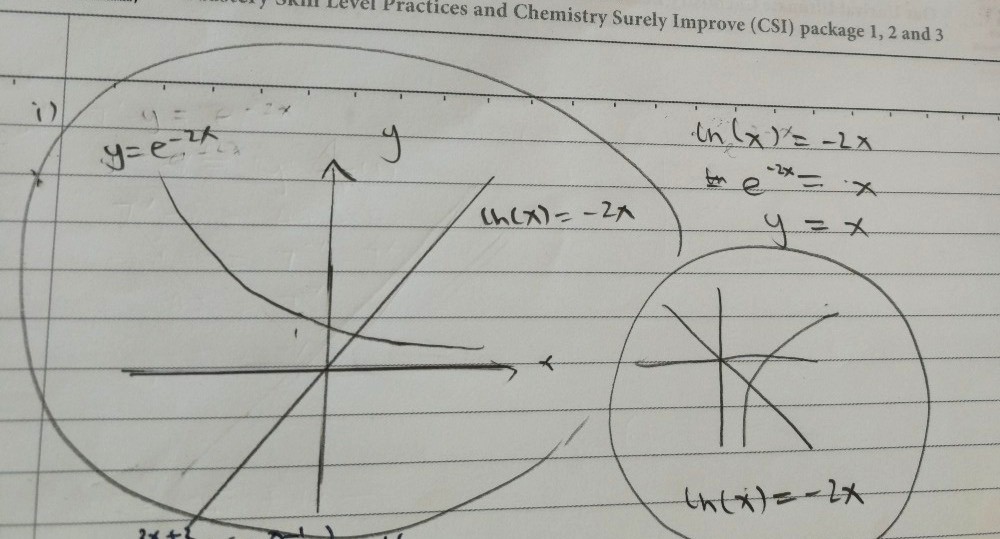
Left is what I plotted and right is the photomath graph... Why are they different??
Date Posted:
2 years ago

When equations are transformed, they result in their corresponding graphs being different, of course! What remains unchanged as we transform the equations is the number of solutions.
Take a simple case of trying to solve the inequality x^2 - 2x > 3.
We plot the graph of y = x^2 - 2x and see where the curve lies above the line y = 3.
Moving the 3 to the other side results in x^2 - 2x - 3 > 0. If we plot the new graph of y = x^2 - 2x - 3, the curves are going to be in entirely different position. However, this time we are solving for y > 0, and the resulting range of values for x remains unchanged.
The left graph is the graph of the transformed equations: y = e^-2x versus y = x.
The right graph is the graph of the original equations: y = ln x against y = -2x.
The right graph is the graph of the original equations: y = ln x against y = -2x.
In other words, whenever we try to modify an equation (such as while trying to transform a long expression into a quadratic expression), we are changing the dynamics of the graphs if we were to plot them on paper.
But the solutions to the equation remain unchanged even as we modify our equations to obtain x.
But the solutions to the equation remain unchanged even as we modify our equations to obtain x.
I got it!! Thank you so much
