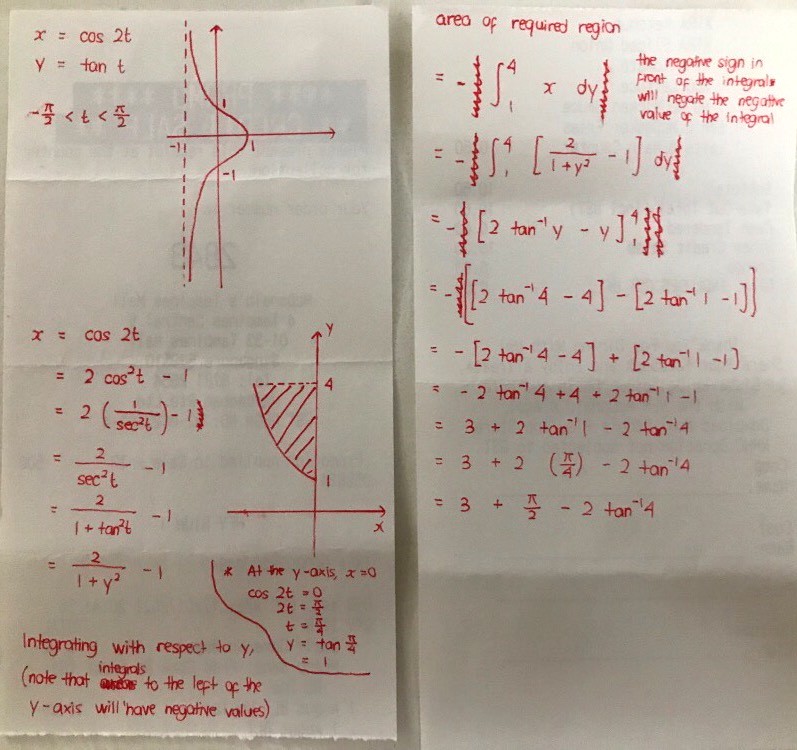
Eric Nicholas K's answer to Anonymous's Junior College 1 H2 Maths Singapore question.
done
{{ upvoteCount }} Upvotes
clear
{{ downvoteCount * -1 }} Downvotes
A sketching of the graph will help you to visualise the desired region more easily. You can plot this on your graphing calculator or on Desmos online.
Date Posted:
4 years ago


