J's answer to Candice's Junior College 1 H2 Maths Singapore question.
done
{{ upvoteCount }} Upvotes
clear
{{ downvoteCount * -1 }} Downvotes

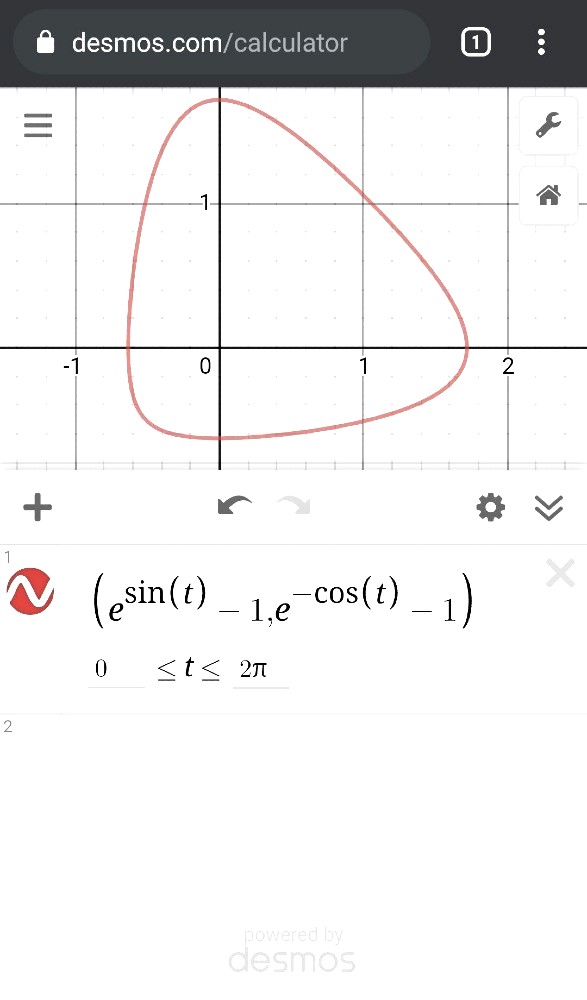
You can plot this using GC in exams, but for visualisation, desmos.com is very useful. Try it on your own someday! I will explain how to get the intercepts and part (ii) in the next post.
Date Posted:
5 years ago

But when i plotted this into my gc, i only got the bottom part of the curve from x=0 onwards, so i was very confused haha
Maybe you can take a photo of it and post it here?
Sometimes it might be the settings of the GC, eg. Scale and zoom in/out
Sometimes it might be the settings of the GC, eg. Scale and zoom in/out
Okies, i just added the pic of the gc as an answer under this qns! And also sorry for the late reply

 360 Tutoring Program