Allann Tay's answer to Piranha's Secondary 3 A Maths Singapore question.
done
{{ upvoteCount }} Upvotes
clear
{{ downvoteCount * -1 }} Downvotes

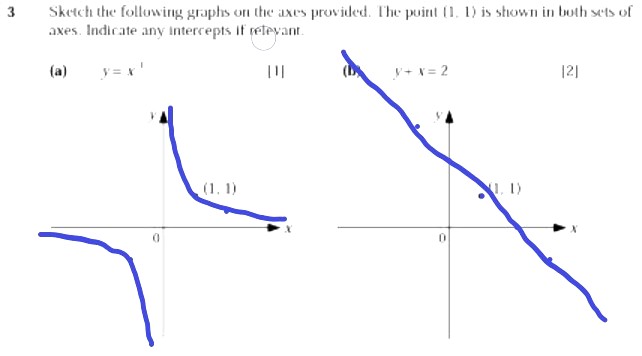
plot the points into the graph using different positive and negative values of x to get value of y and you should get the shape of the graph easily.
Date Posted:
3 years ago

Hi I think u should indicate x and y intercepts for second graph as stated in question.
