Eric Nicholas K's answer to LockB's Secondary 3 A Maths Singapore question.
done
{{ upvoteCount }} Upvotes
clear
{{ downvoteCount * -1 }} Downvotes

The tangent graphs operate differently from regular sine or cosine graphs.
Date Posted:
6 years ago
These are the hardest to draw and it's not immediately obvious why the graphs are as such. But note that tan 90, tan 270, tan 450, tan 630, tan 810 and so on are undefined.

i still dont really understand how the amplitude, full cycle and scale work here, can you explain to me again? will really appreciate it :)
how to determine the scale tho as pi/8 is really small
how to determine the scale tho as pi/8 is really small
The amplitude does not exist for tangent graphs, because amplitude represents the distance from the centre value to the max/min value, but the tangent graph does not exhibit any turning points at all, so the amplitude cannot be calculated.
A typical tangent graph y = tan x completes one full cycle in 180 degrees. So, the frequency is 1 cycle (per 180 degrees) and the period is 180 degrees.
For things like y = tan 2x, the graph has a frequency of 2, so the graph completes 2 full cycles in 180 degrees.
Depending on the given range by the question which we must follow, we may need to draw more or fewer cycles.
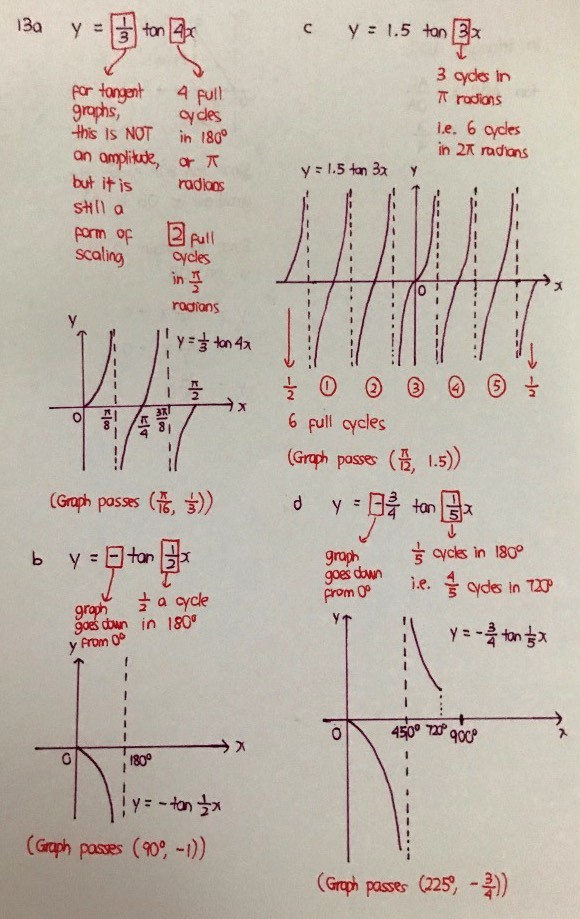
Take the first example, y = 1/3 tan 4x.
Because its frequency is 4, the graph completes 4 cycles in 180 degrees (or pi radians). However, the question wants us to draw within 0 radians to pi/2 radians.
So,
pi radians ==> 4 cycles
pi/2 radians ==> 2 cycles
We need to draw two cycles of the graph.
In the normal "y = tan x" case, the forbidden values of x (i.e. the vertical dotted lines) fall within 90, 270, 450 and so on. Since the amplitude here is 4, we divide these forbidden values by 4 as well, to get 22.5, 67.5, 112.5 and so on (represented as pi/8, 3pi/8, 5pi/8, ...).
We only need to draw the graph up to pi/2 radians.
A typical tangent graph y = tan x completes one full cycle in 180 degrees. So, the frequency is 1 cycle (per 180 degrees) and the period is 180 degrees.
For things like y = tan 2x, the graph has a frequency of 2, so the graph completes 2 full cycles in 180 degrees.
Depending on the given range by the question which we must follow, we may need to draw more or fewer cycles.
Take the first example, y = 1/3 tan 4x.
Because its frequency is 4, the graph completes 4 cycles in 180 degrees (or pi radians). However, the question wants us to draw within 0 radians to pi/2 radians.
So,
pi radians ==> 4 cycles
pi/2 radians ==> 2 cycles
We need to draw two cycles of the graph.
In the normal "y = tan x" case, the forbidden values of x (i.e. the vertical dotted lines) fall within 90, 270, 450 and so on. Since the amplitude here is 4, we divide these forbidden values by 4 as well, to get 22.5, 67.5, 112.5 and so on (represented as pi/8, 3pi/8, 5pi/8, ...).
We only need to draw the graph up to pi/2 radians.
how to determine the scale tho as pi/8 is really small
In reality you will be drawing the graph using a larger space. I cramped everything into a small space, but in your case, you can just draw a bigger graph.
In reality you will be drawing the graph using a larger space. I cramped everything into a small space, but in your case, you can just draw a bigger graph.
i dont really understand part c and d
how does a negative graph look like in a typical graph?
for qn2 (in the pic) will the period be pi, because frequency is 1 so it will be pi/1 = pi
how does a negative graph look like in a typical graph?
for qn2 (in the pic) will the period be pi, because frequency is 1 so it will be pi/1 = pi
btw what is the graph passes..... thing
I will update you again when I am more free, since I am now quite tired
i dont really understand part c and d
how does a negative graph look like in a typical graph?
for qn2 (in the pic) will the period be pi, because frequency is 1 so it will be pi/1 = pi
btw what is the graph passes..... thing
----------------------------------------------------------
In part c, the graph is the same as that of a regular case, except that the range is allowed to go into the negative case. The range given for drawing is -pi to pi (i.e. -180 to 180), or basically a full 360 degrees worth of diagrams except that the starting point is -pi instead of 0.
So, we need to draw 360 degrees worth of the graph. Since the frequency of the graph is 3, it means that the graph completes 3 full cycles in 180 degrees. Consequently, the graph completes 6 full cycles in 360 degrees, so we need to draw a total of 6 full cycles for the graph. The 6 full cycles come in the form of half a cycle, followed by 5 full cycles and half a cycle as I have drawn. Do you remember the original tan x graph where 2 cycles must be drawn? But that graph is drawn in the form of half a cycle, followed by one full cycle and half a cycle in a similar way to my diagram.
In part d, the frequency of 1/5 indicates that 1/5 of a full cycle is completed in 180 degrees. of a full cycle is completed in 900 degrees. We are asked to draw from 0 to 720 only, and by the same ratio, we draw 4/5 of a cycle in 720 degrees. It completes more than half a cycle, but less than one full cycle. Hence, my graph terminates halfway. Had the graph continued, it would have cut the x axis at the 900 degree mark.
Ok, I forgot fully about Q2, I will explain this to you now by text and then you can try first on your own. As you noted, there is only a frequency of 1, so the graph completes a cycle in pi radians. So, the period is pi radians. Because there is a negative sign in front, we draw the graph heading downwards instead of upwards.
I put "the graph passes..." to indicate the significance of the coefficient of tan x. This is because we are unable to distinguish tan x, 2 tan x, 3 tan x, 4 tan x and so on if we draw them on separate axes (since we do not have maximum or minimum points to take reference from, so we can't tell the equation of the graph given the graph, so we need such additional information to distinguish the graphs).
how does a negative graph look like in a typical graph?
for qn2 (in the pic) will the period be pi, because frequency is 1 so it will be pi/1 = pi
btw what is the graph passes..... thing
----------------------------------------------------------
In part c, the graph is the same as that of a regular case, except that the range is allowed to go into the negative case. The range given for drawing is -pi to pi (i.e. -180 to 180), or basically a full 360 degrees worth of diagrams except that the starting point is -pi instead of 0.
So, we need to draw 360 degrees worth of the graph. Since the frequency of the graph is 3, it means that the graph completes 3 full cycles in 180 degrees. Consequently, the graph completes 6 full cycles in 360 degrees, so we need to draw a total of 6 full cycles for the graph. The 6 full cycles come in the form of half a cycle, followed by 5 full cycles and half a cycle as I have drawn. Do you remember the original tan x graph where 2 cycles must be drawn? But that graph is drawn in the form of half a cycle, followed by one full cycle and half a cycle in a similar way to my diagram.
In part d, the frequency of 1/5 indicates that 1/5 of a full cycle is completed in 180 degrees. of a full cycle is completed in 900 degrees. We are asked to draw from 0 to 720 only, and by the same ratio, we draw 4/5 of a cycle in 720 degrees. It completes more than half a cycle, but less than one full cycle. Hence, my graph terminates halfway. Had the graph continued, it would have cut the x axis at the 900 degree mark.
Ok, I forgot fully about Q2, I will explain this to you now by text and then you can try first on your own. As you noted, there is only a frequency of 1, so the graph completes a cycle in pi radians. So, the period is pi radians. Because there is a negative sign in front, we draw the graph heading downwards instead of upwards.
I put "the graph passes..." to indicate the significance of the coefficient of tan x. This is because we are unable to distinguish tan x, 2 tan x, 3 tan x, 4 tan x and so on if we draw them on separate axes (since we do not have maximum or minimum points to take reference from, so we can't tell the equation of the graph given the graph, so we need such additional information to distinguish the graphs).
i kind of have the idea that the graph will complete 2 full cycle in 2pi and it will go downwards from 0 degree as it have a negative amplitude but i cant draw it our as i cant visualise how the complete negative tangent graph look like.
can you help me with it? i also don't know how to do part (iii) as i have never encountered this question before. will appreciate if you help me :)
can you help me with it? i also don't know how to do part (iii) as i have never encountered this question before. will appreciate if you help me :)
It will be a reflection in the horizontal axis.
If I can remember later and I am not too tired, I draw tonight.
If I can remember later and I am not too tired, I draw tonight.
ok thx:)
how to determine where the graph passes?
One way is to do this:
y = 5 tan x
When y = 5,
Tan x = 1
x = 45 deg or pi/4 rad
y = 5 tan x
When y = 5,
Tan x = 1
x = 45 deg or pi/4 rad
we just move the 5 to the other side? why tanx equals to 1 tho
5 Tan x = 5
Tan x = 1
The easiest is to choose this point.
Tan x = 1
The easiest is to choose this point.
thx :)

 360 Tutoring Program