Eric Nicholas K's answer to LockB's Secondary 3 A Maths Singapore question.
done
{{ upvoteCount }} Upvotes
clear
{{ downvoteCount * -1 }} Downvotes

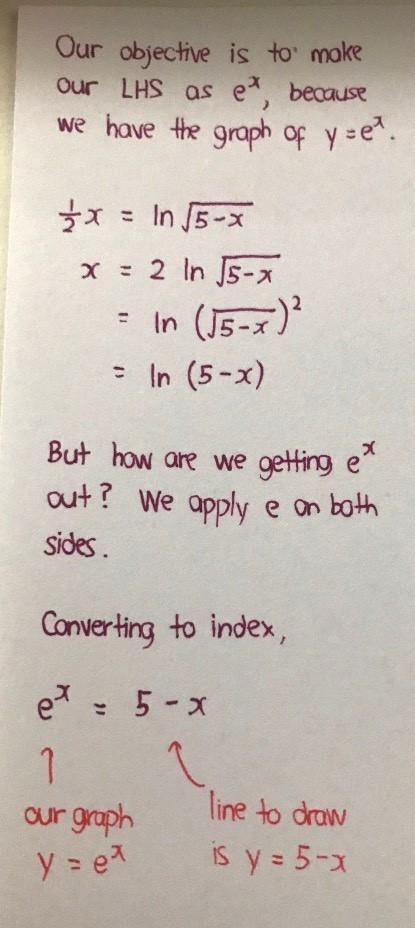
This is an important technique for both E and A Maths. That is, transforming the given equation such that one side becomes the equation of the graph which we already have. The other is a linear equation graph for your syllabus.
Date Posted:
6 years ago

for part (i) how to know how will the graph look like tho? or is there a standard graph for logarithms
The shapes for logarithmic graphs are divided into two parts. Graphs for bases between 0 and 1 (not including 0 and 1) and graphs for bases above 1. Two different but related kinds, but within the same group, the shapes are the same.
Same for exponential, there are two groups to consider. Bases between 0 and 1 and bases above 1.
Same for exponential, there are two groups to consider. Bases between 0 and 1 and bases above 1.

 360 Tutoring Program