Lin Jia Liang's answer to Piranha's Secondary 3 A Maths Singapore question.
done
{{ upvoteCount }} Upvotes
clear
{{ downvoteCount * -1 }} Downvotes

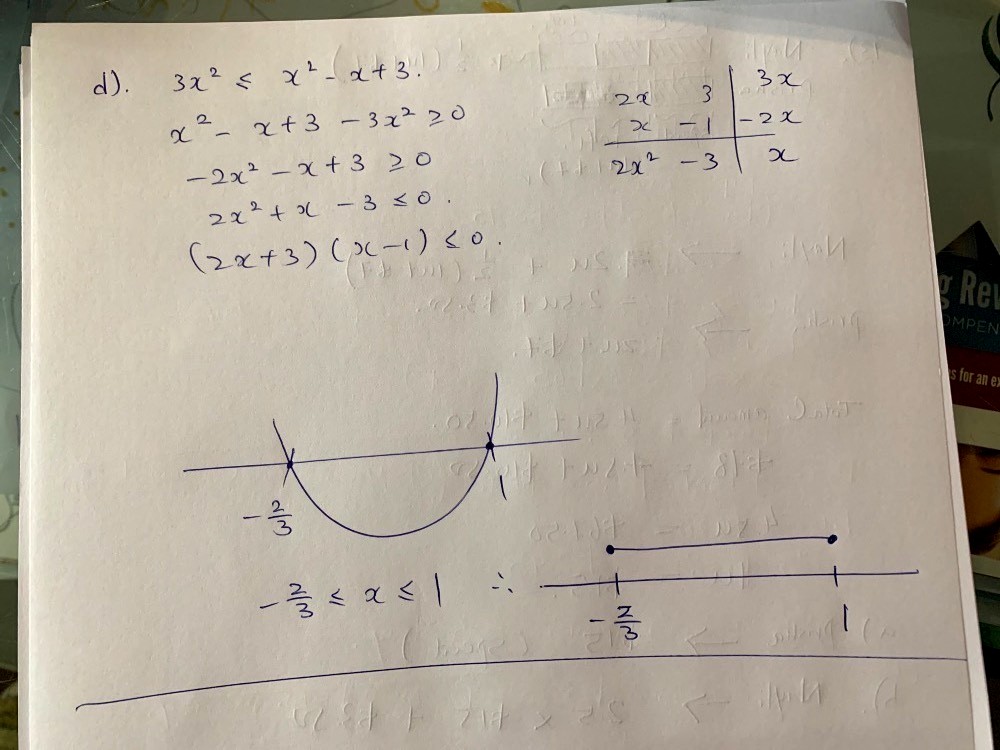
The graph below the axis is the range of value of x. Number line is shown as on the right.
Date Posted:
4 years ago
