Hafsa Sheikh's answer to Parody's Secondary 4 E Maths Singapore question.
done
{{ upvoteCount }} Upvotes
clear
{{ downvoteCount * -1 }} Downvotes
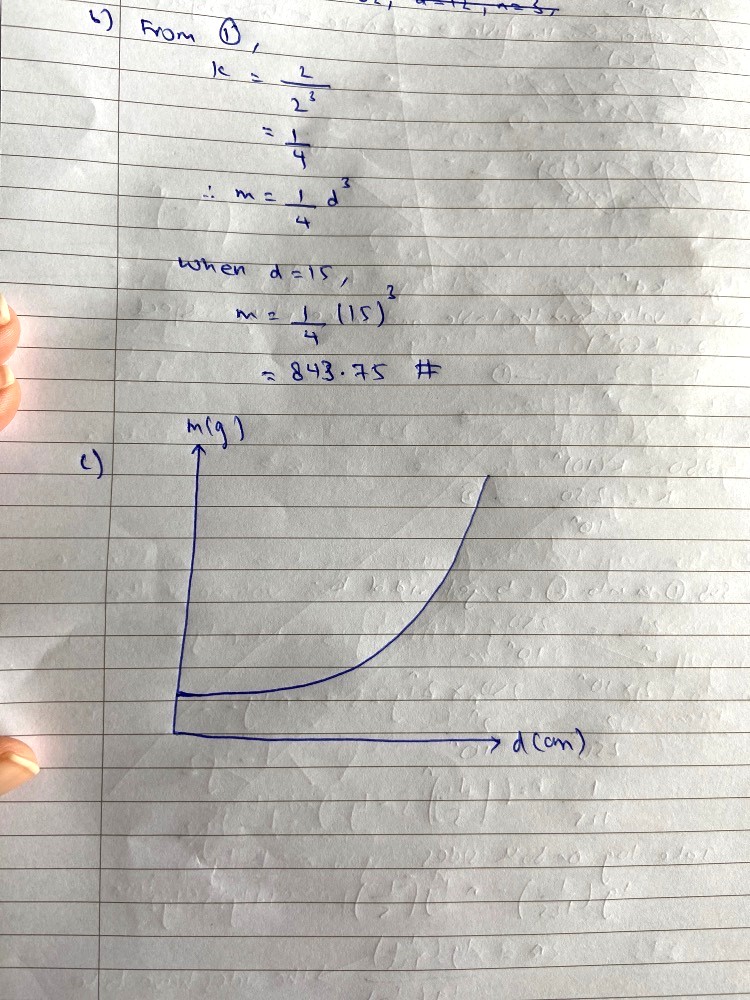
This is for part b and c. The graph is as shown because of the cubic expression and because when d increases, m increases more than proportionately which is also evident from the data given in the table.
Date Posted:
4 years ago
