Eric Nicholas K's answer to immanlyn's Junior College 1 H2 Maths Singapore question.
done
0 Upvotes
clear 0 Downvotes
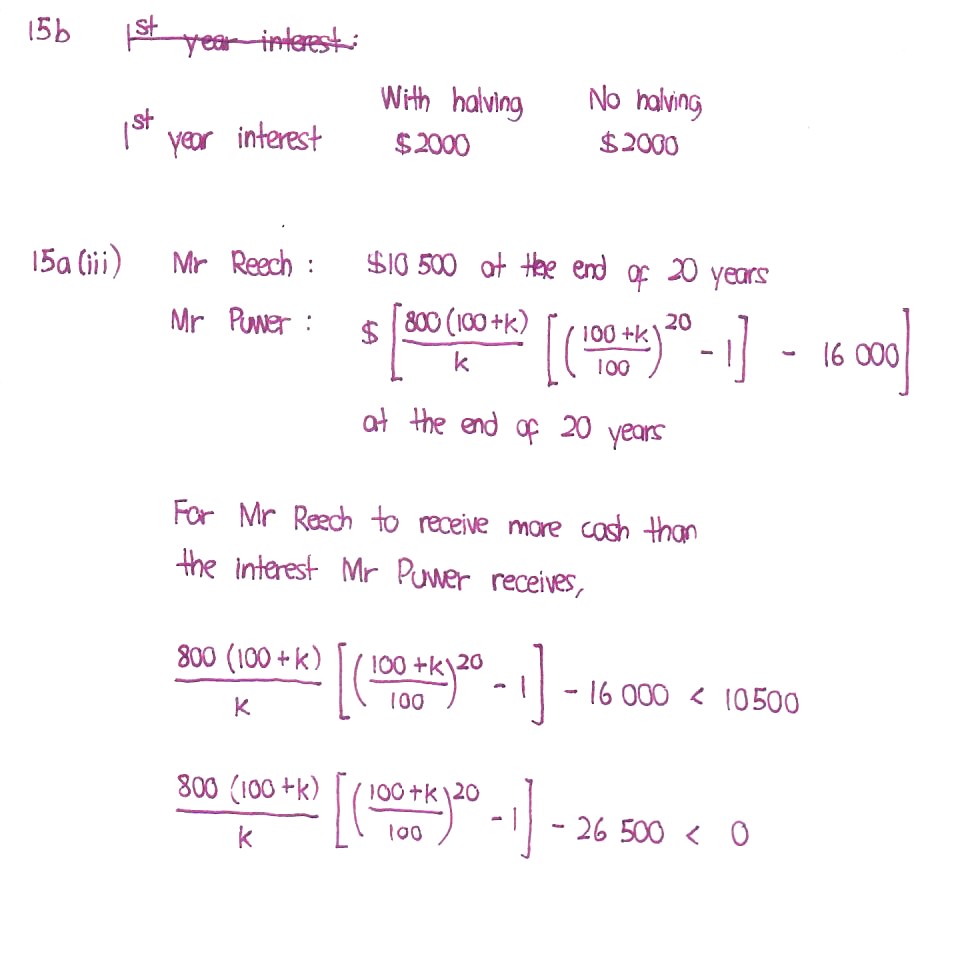
Q15aiii; The graph at the end is plotted somewhere on a graphing calculator or software and then we look for the regions where the graph is below the k-axis; we should get 0 < k < 4.591. Will plot the relevant graph next.
Date Posted:
5 years ago
Ignore the first part on top


