Eric Nicholas K's answer to trish's Secondary 3 A Maths Singapore question.
done
{{ upvoteCount }} Upvotes
clear
{{ downvoteCount * -1 }} Downvotes

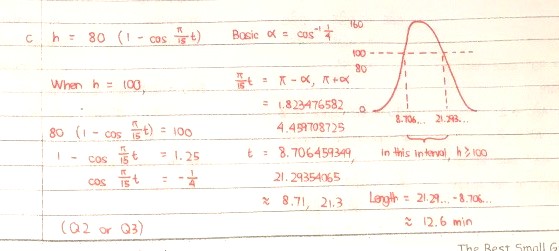
Something like this would be good. We pretend h = 100 first.
To see afterwards for the regions where h >= 100, we do a visual sketch of the graph to help us.
Or, you can randomly substitute numbers not equaling to the two values of t found earlier to see whether h is more than or less than 100 before determining the inequality signs.
To see afterwards for the regions where h >= 100, we do a visual sketch of the graph to help us.
Or, you can randomly substitute numbers not equaling to the two values of t found earlier to see whether h is more than or less than 100 before determining the inequality signs.
Date Posted:
4 years ago

oh i see, thank you so much for the detailed explanation! :)
