Eric Nicholas K's answer to Elaine's Junior College 1 H2 Maths Singapore question.
done
{{ upvoteCount }} Upvotes
clear
{{ downvoteCount * -1 }} Downvotes
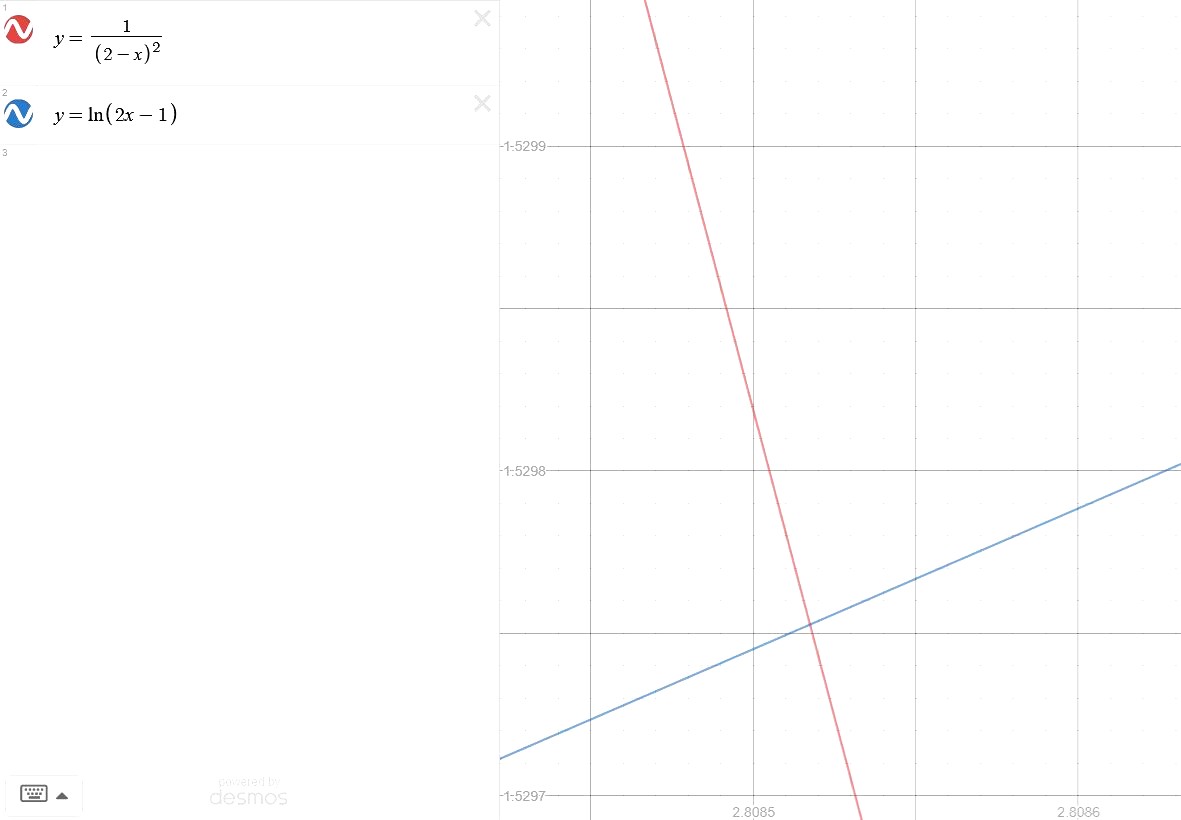
Without further knowledge, this question cannot be solved algebraically. I used the Desmos online graphing calculator to plot both graphs and subsequently zoomed in on the intersection of approximately 2.80852.
The red graph is the graph of (2 - x)^-2 while the blue graph is the graph of ln (2x - 1).
For (2 - x)^-2 to have a greater value than ln (2x - 1), the red graph must lie above the blue graph.
By inspection of the entire region (both the negative x and positive x regions),
x < 2.80852.
The red graph is the graph of (2 - x)^-2 while the blue graph is the graph of ln (2x - 1).
For (2 - x)^-2 to have a greater value than ln (2x - 1), the red graph must lie above the blue graph.
By inspection of the entire region (both the negative x and positive x regions),
x < 2.80852.
Date Posted:
5 years ago


