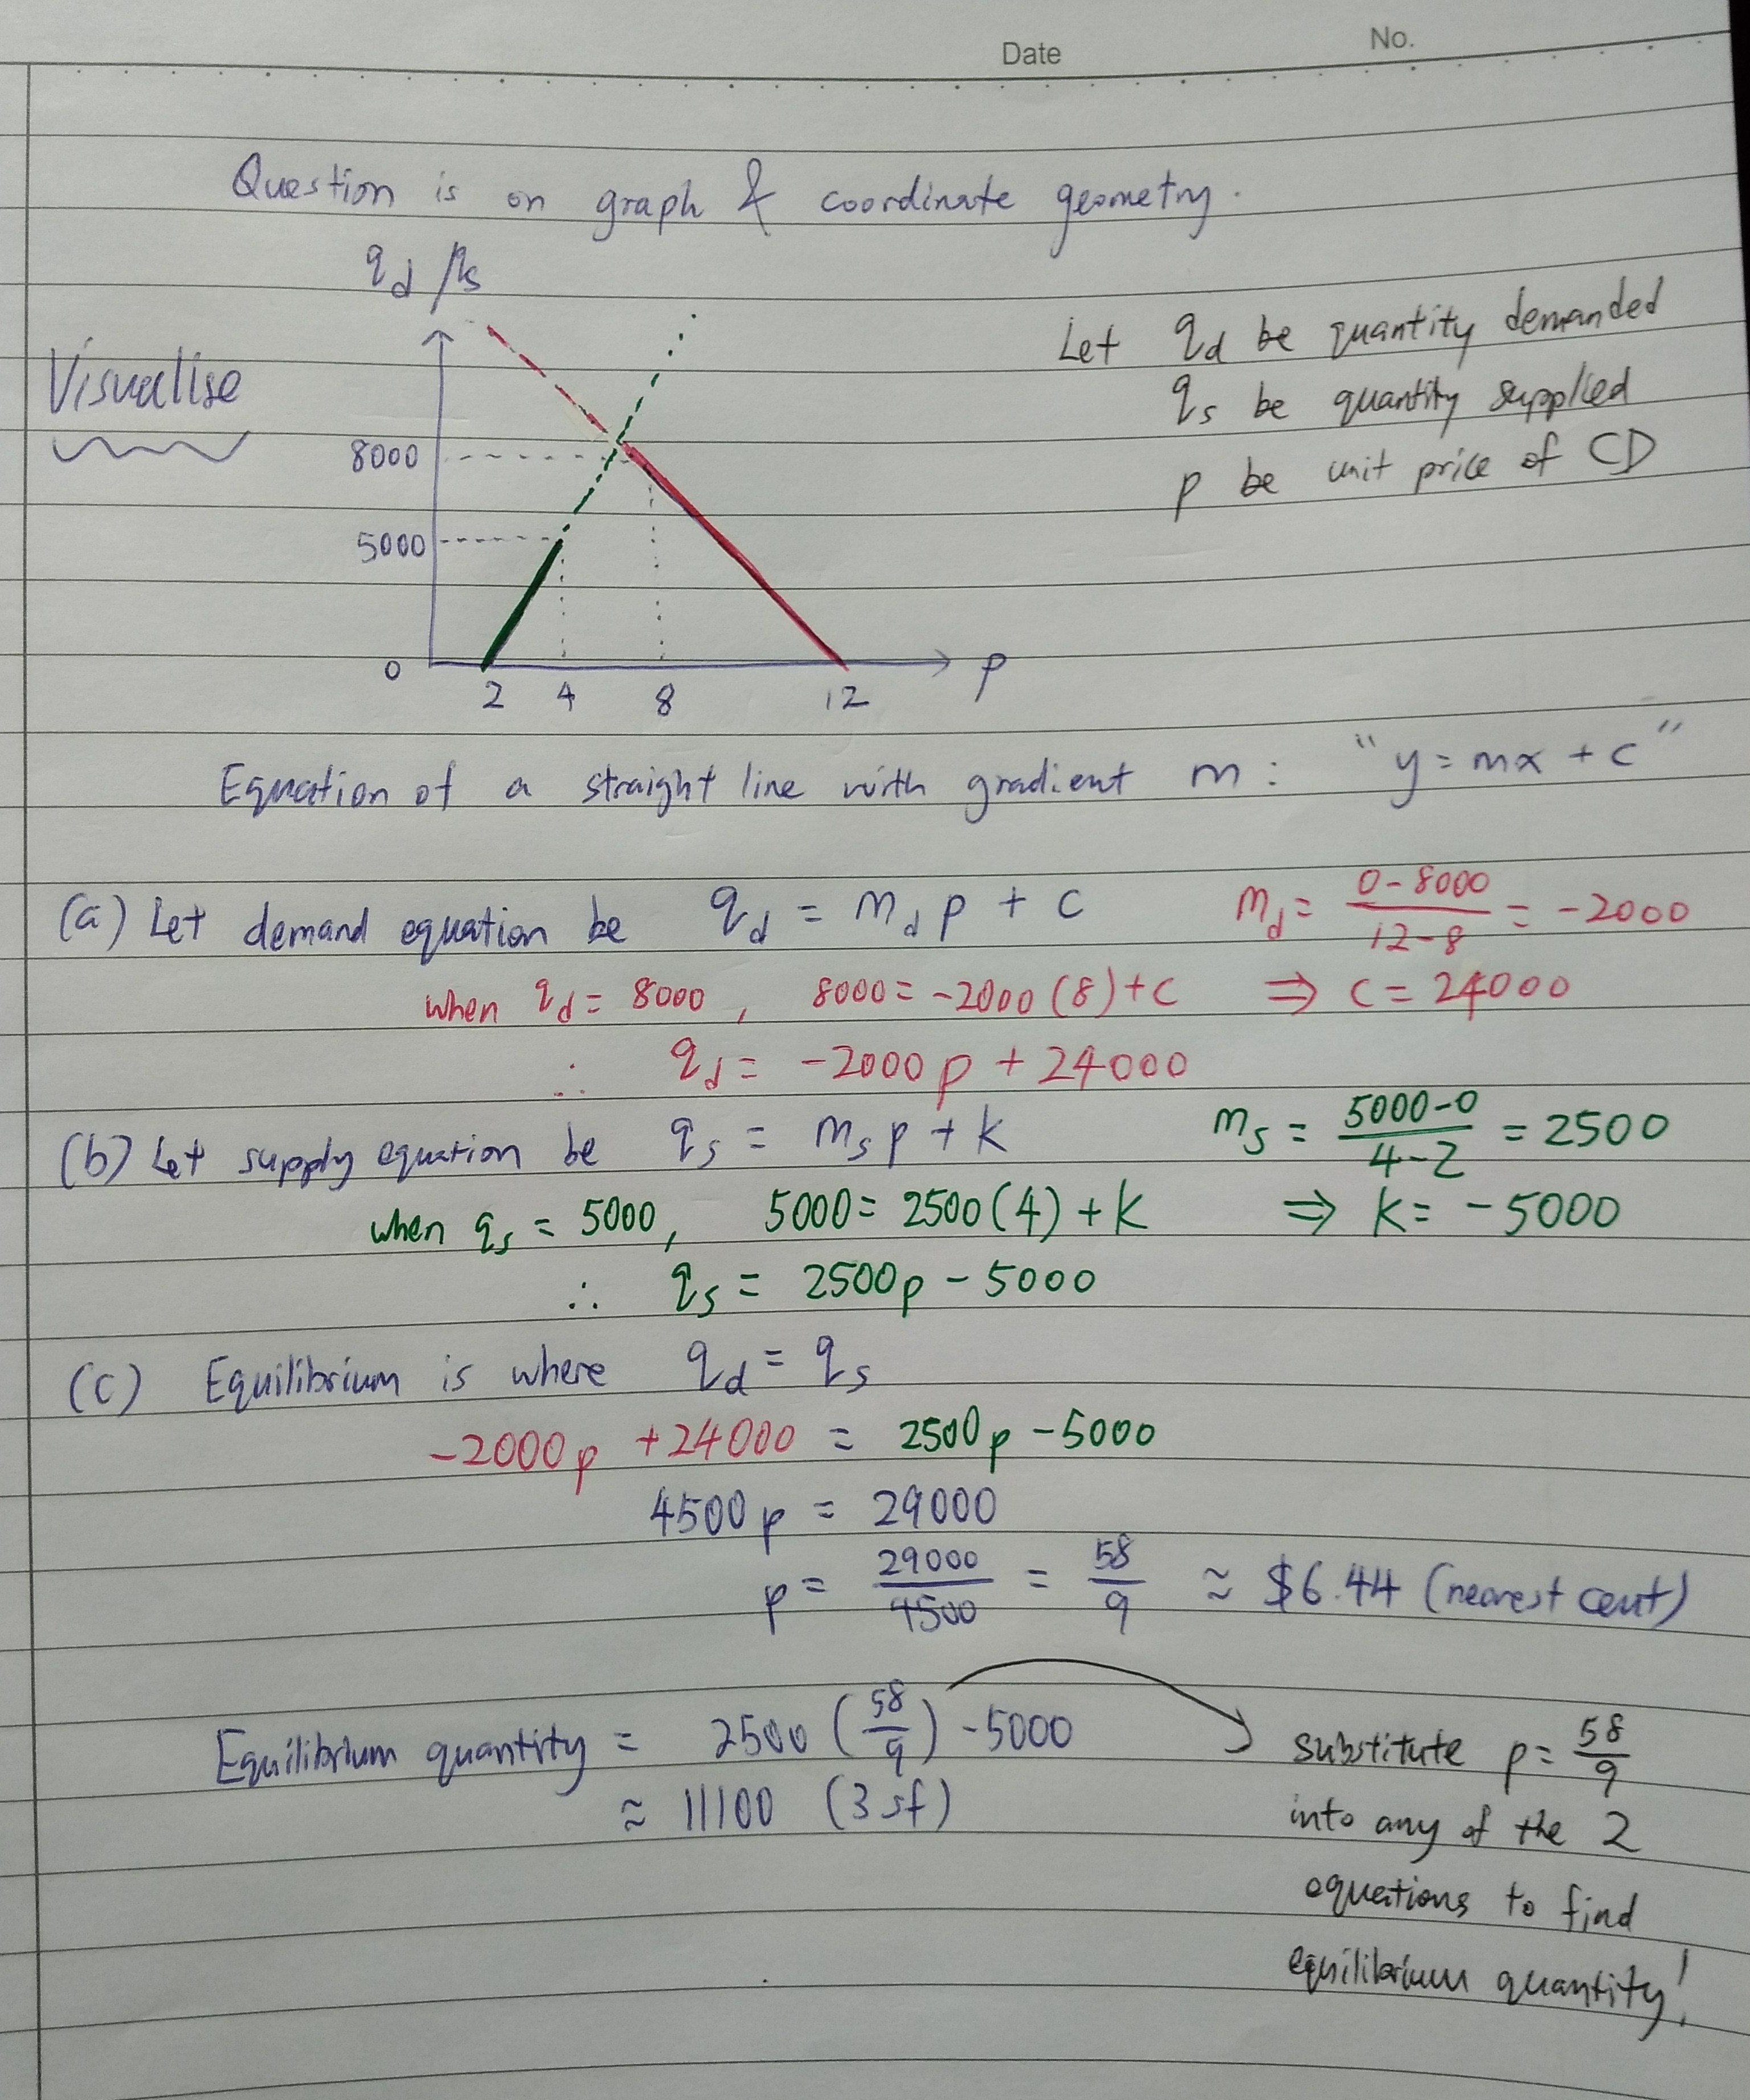
Max's answer to Hamim's Junior College 1 H1 Maths question.
done
2 Upvotes
clear 0 Downvotes

The graph is to help you visualise the equations.
Recall equation of straight line (question says the equations are linear, so mx+c)
Find gradient of line, y-intercept then obtain equation. Repeat for supply equation.
Equate both demand and supply equations to find intersection point, which is equilibrium point.
Solve for equilibrium price, and substitute this number back into demand/supply equation to obtain equilibrium quantity.
Hope this helps!
Date Posted:
6 years ago
Thankyouu

