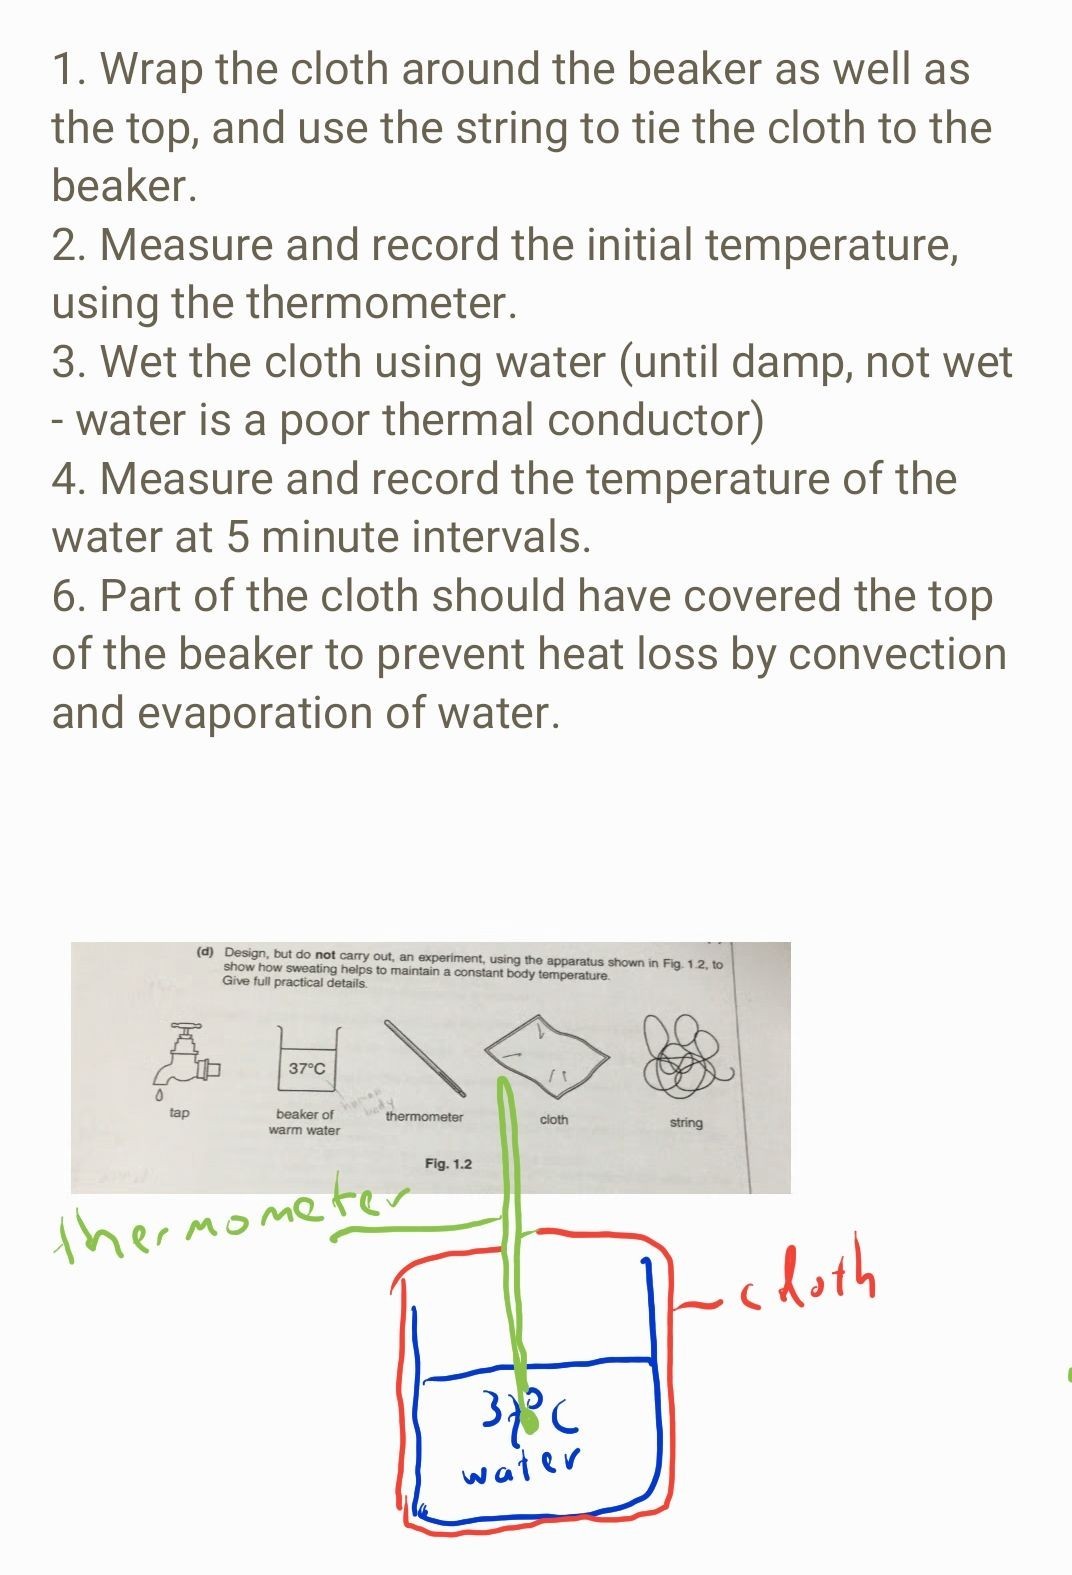
Arnold K H Tan's answer to Wen's Secondary 3 Biology question.
done
{{ upvoteCount }} Upvotes
clear
{{ downvoteCount * -1 }} Downvotes

Repeat the experiment and calculate the average result.
Results can be displayed graphically.
Results can be displayed graphically.
Date Posted:
6 years ago
I get it now. Thank you!
So for this experiment, what is the independent variable?
Time. Plot on your horizontal axis. The dependent variable is temperature, which is plotted on the vertical axis.


