Jenny's answer to gcjw's Secondary 3 A Maths question.
done
{{ upvoteCount }} Upvotes
clear
{{ downvoteCount * -1 }} Downvotes

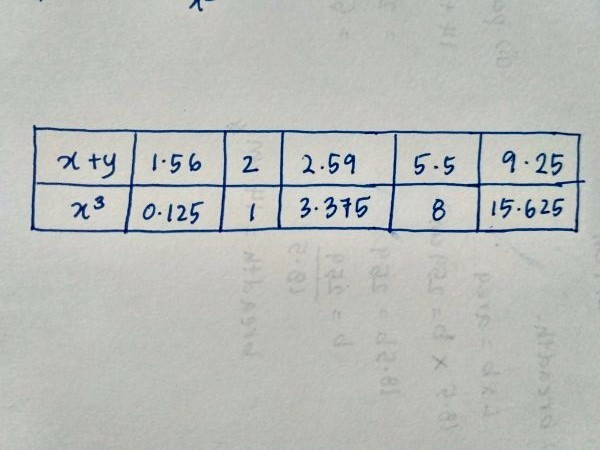
First, do a new table following the question which is (x+y) and x³.
Then, plot the graph based on the new table.
Then, plot the graph based on the new table.
Date Posted:
9 years ago

Thank you !!

 360 Tutoring Program