AC Lim's answer to H's Secondary 2 Maths Singapore question.
done
{{ upvoteCount }} Upvotes
clear
{{ downvoteCount * -1 }} Downvotes

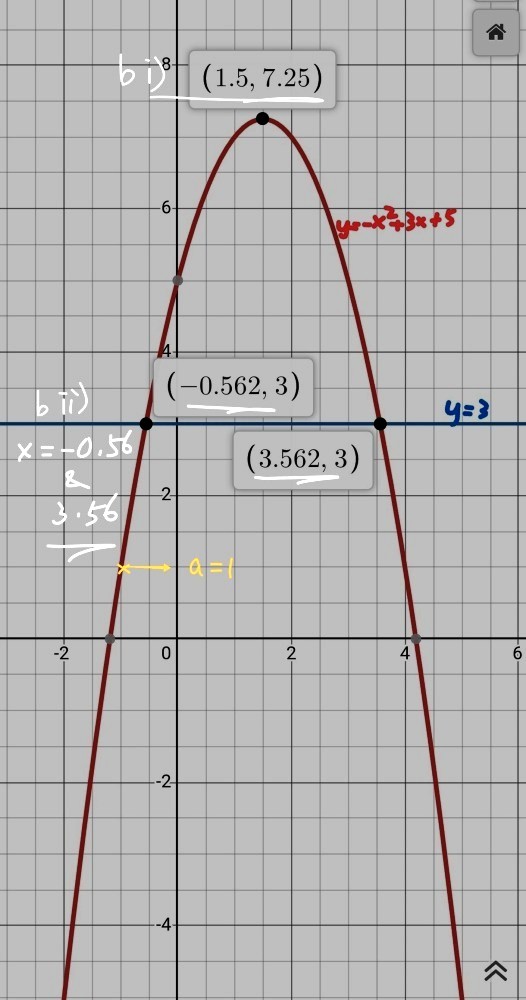
Your graph should look like this. You need to draw according to question criteria. .. use 2cm for 1 unit on both axis, label axis x and y, label all line. Range for x-axis from -1.5 to 4.5. Answer for a= 1 for the table. Hope this helps.
Date Posted:
8 months ago
