Eric Nicholas K's answer to nancy's Junior College 1 H2 Maths Singapore question.
done
{{ upvoteCount }} Upvotes
clear
{{ downvoteCount * -1 }} Downvotes

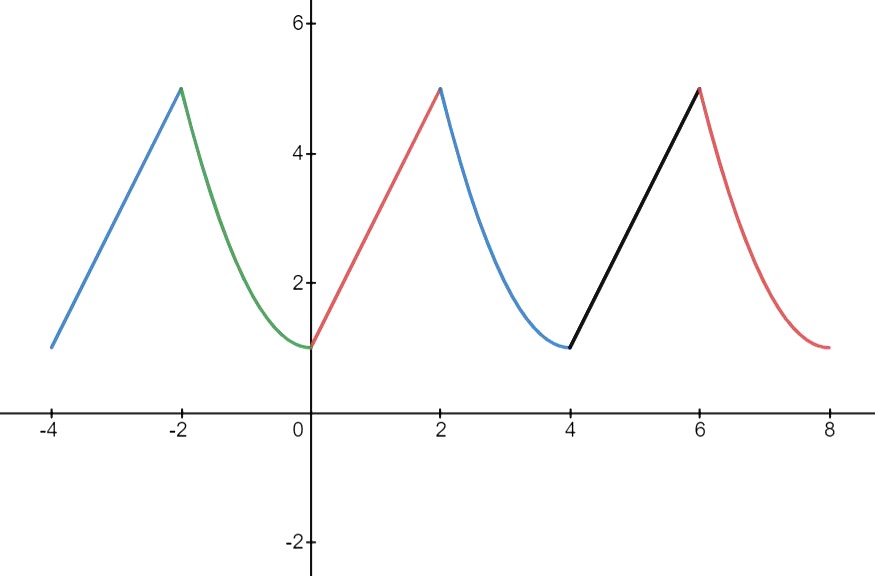
This is how the graph of f(x) will look like. We call this a periodic function where the graph repeats itself every four units of x, with the base shape in the region x = 0 to x = 4. The original function f(x) itself can be called a piecewise function because it is defined by two or more "pieces" or fragments of equations coming together.
You can refer to the main chat comments for part (i).
As for part (iii), the range of f simply refers to the output values (coming from the vertical axis on the graph). As we can see, the vertical values of the graph go from 1 to 5, so the range of f is given by [1, 5]. Note my usage of the open bracket "[" and the close bracket "]".
Date Posted:
2 years ago
