Ask Singapore Homework?

Upload a photo of a Singapore homework and someone will email you the solution for free.


Question

secondary 4 | E Maths
One Answer Below

Anyone can contribute an answer, even non-tutors.

Answer This Question
Cyrex
Cyrex

secondary 4 chevron_right E Maths

Plz help

Date Posted: 6 years ago
Views: 317

See 1 Answer

done {{ upvoteCount }} Upvotes
clear {{ downvoteCount * -1 }} Downvotes
Olivier Mout
Olivier Mout's answer
24 answers (A Helpful Person)
1st
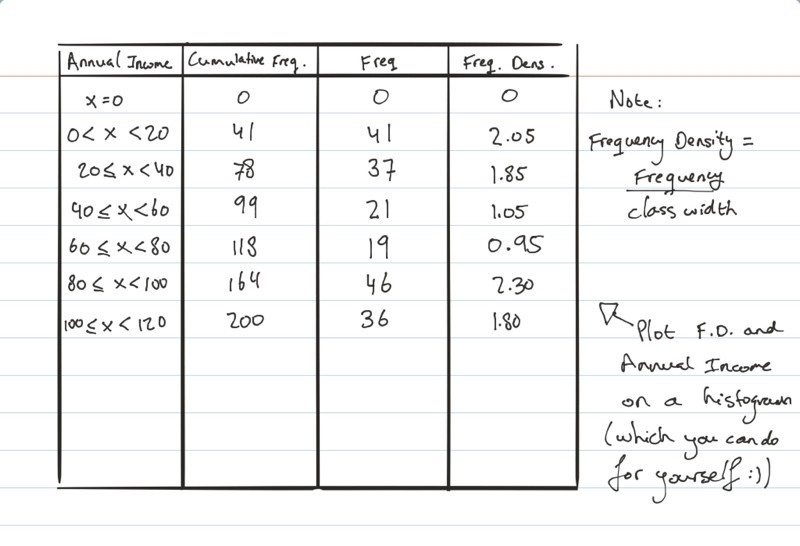
If you don't know how to plot you let me know, but I think this will set you off.
Olivier Mout
Olivier Mout
6 years ago
The most likely income will be the one with the highest frequency density, being between 80 and 100 thousand.
Cyrex
Cyrex
6 years ago
Thx for the guide but I'm still quite confused over the frequency density part. What is that? Is that really necessary to plot a histogram? :)
Olivier Mout
Olivier Mout
6 years ago
Frequency density shows how closely packed the 'stuff' within a class really is. This is useful as it truly shows how the frequency is distributed across the classes in a histogram.

Say, hypothetically: there are 100 families earning between 0 and 100 thousand dollars a year. There are also 20 families earning between 100 and 110 thousand dollars. Even though there are fewer families in the second class, it is more common. This is because there is a higher density of families within it.
Olivier Mout
Olivier Mout
6 years ago
A histogram is unique because at a glance it shows the most common and least common classes, because of the frequency density. It is not a histogram if there is no frequency density on the y axis.
Olivier Mout
Olivier Mout
6 years ago
By definition, the frequency density is the number of occurrences per unit of class width.
Cyrex
Cyrex
6 years ago
Thx a lot for the help. I get it now