Ask Singapore Homework?
Upload a photo of a Singapore homework and someone will email you the solution for free.

Question
secondary 2 | Maths
One Answer Below
This question need another answer.

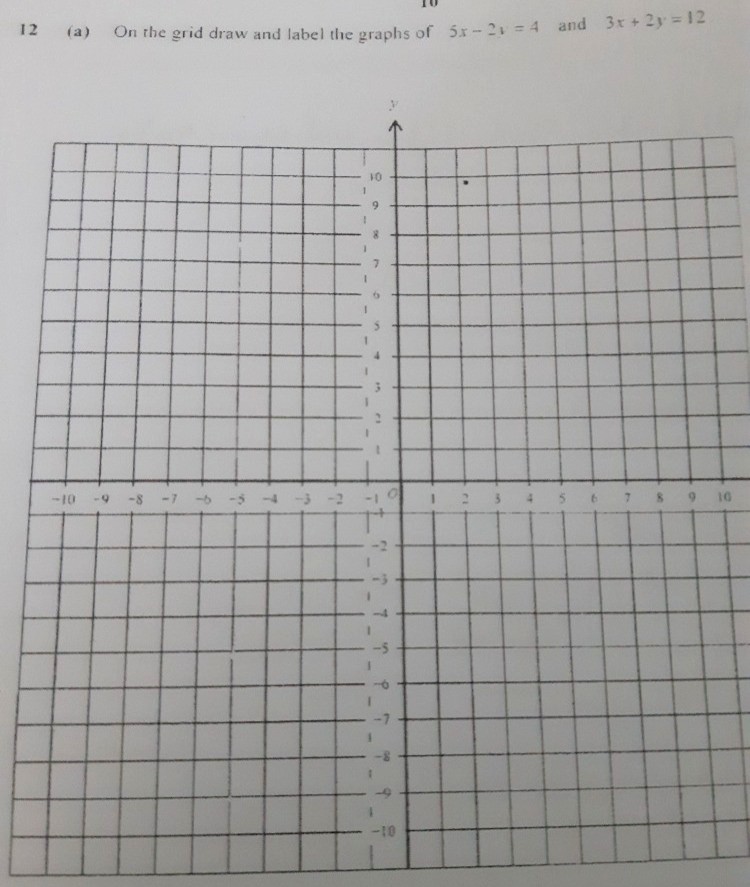
How do you solve simultaneous equations graphically? I do not know how to plot the points. Any help would be greatly appreciated.
Date Posted: 3 years ago
Views: 269
See 1 Answer
To plot the graphs of linear equations, you can simply sub in certain values of x and then find out the value of y when x is that value
For example, for the linear equation 5x - 2y = 4, we can try subing in the value of x = 0 and x = 2.
For x = 0,
5(0) - 2y = 4
-2y = 4
y = 4/(-2)
y = -2
Therefore, when x = 0, y = -2
For x = 2,
5(2) - 2y = 4
10 - 2y = 4
-2y = 4 - 10 = -6
y = (-6)/(-2)
y = 3
Therefore, when x = 2, y =3
From these, you can plot the points of (0,-2) and (2,3), and then draw a line that intersects these two points for the graph of 5x - 2y =4
You can then repeat this process for the other equation as well

Unclear