Ask Singapore Homework?
Upload a photo of a Singapore homework and someone will email you the solution for free.


Question
secondary 2 | Maths
3 Answers Below
Anyone can contribute an answer, even non-tutors.

I dont really understand question 2, for part (a) they give the value if x that is -1 to 2 which is odd cause i was thinking of -2 to 2 but for the y axis they did not give value. So how do i exactly draw the graph?
Date Posted: 7 years ago
Views: 554
See 3 Answers
done
{{ upvoteCount }} Upvotes
clear
{{ downvoteCount * -1 }} Downvotes

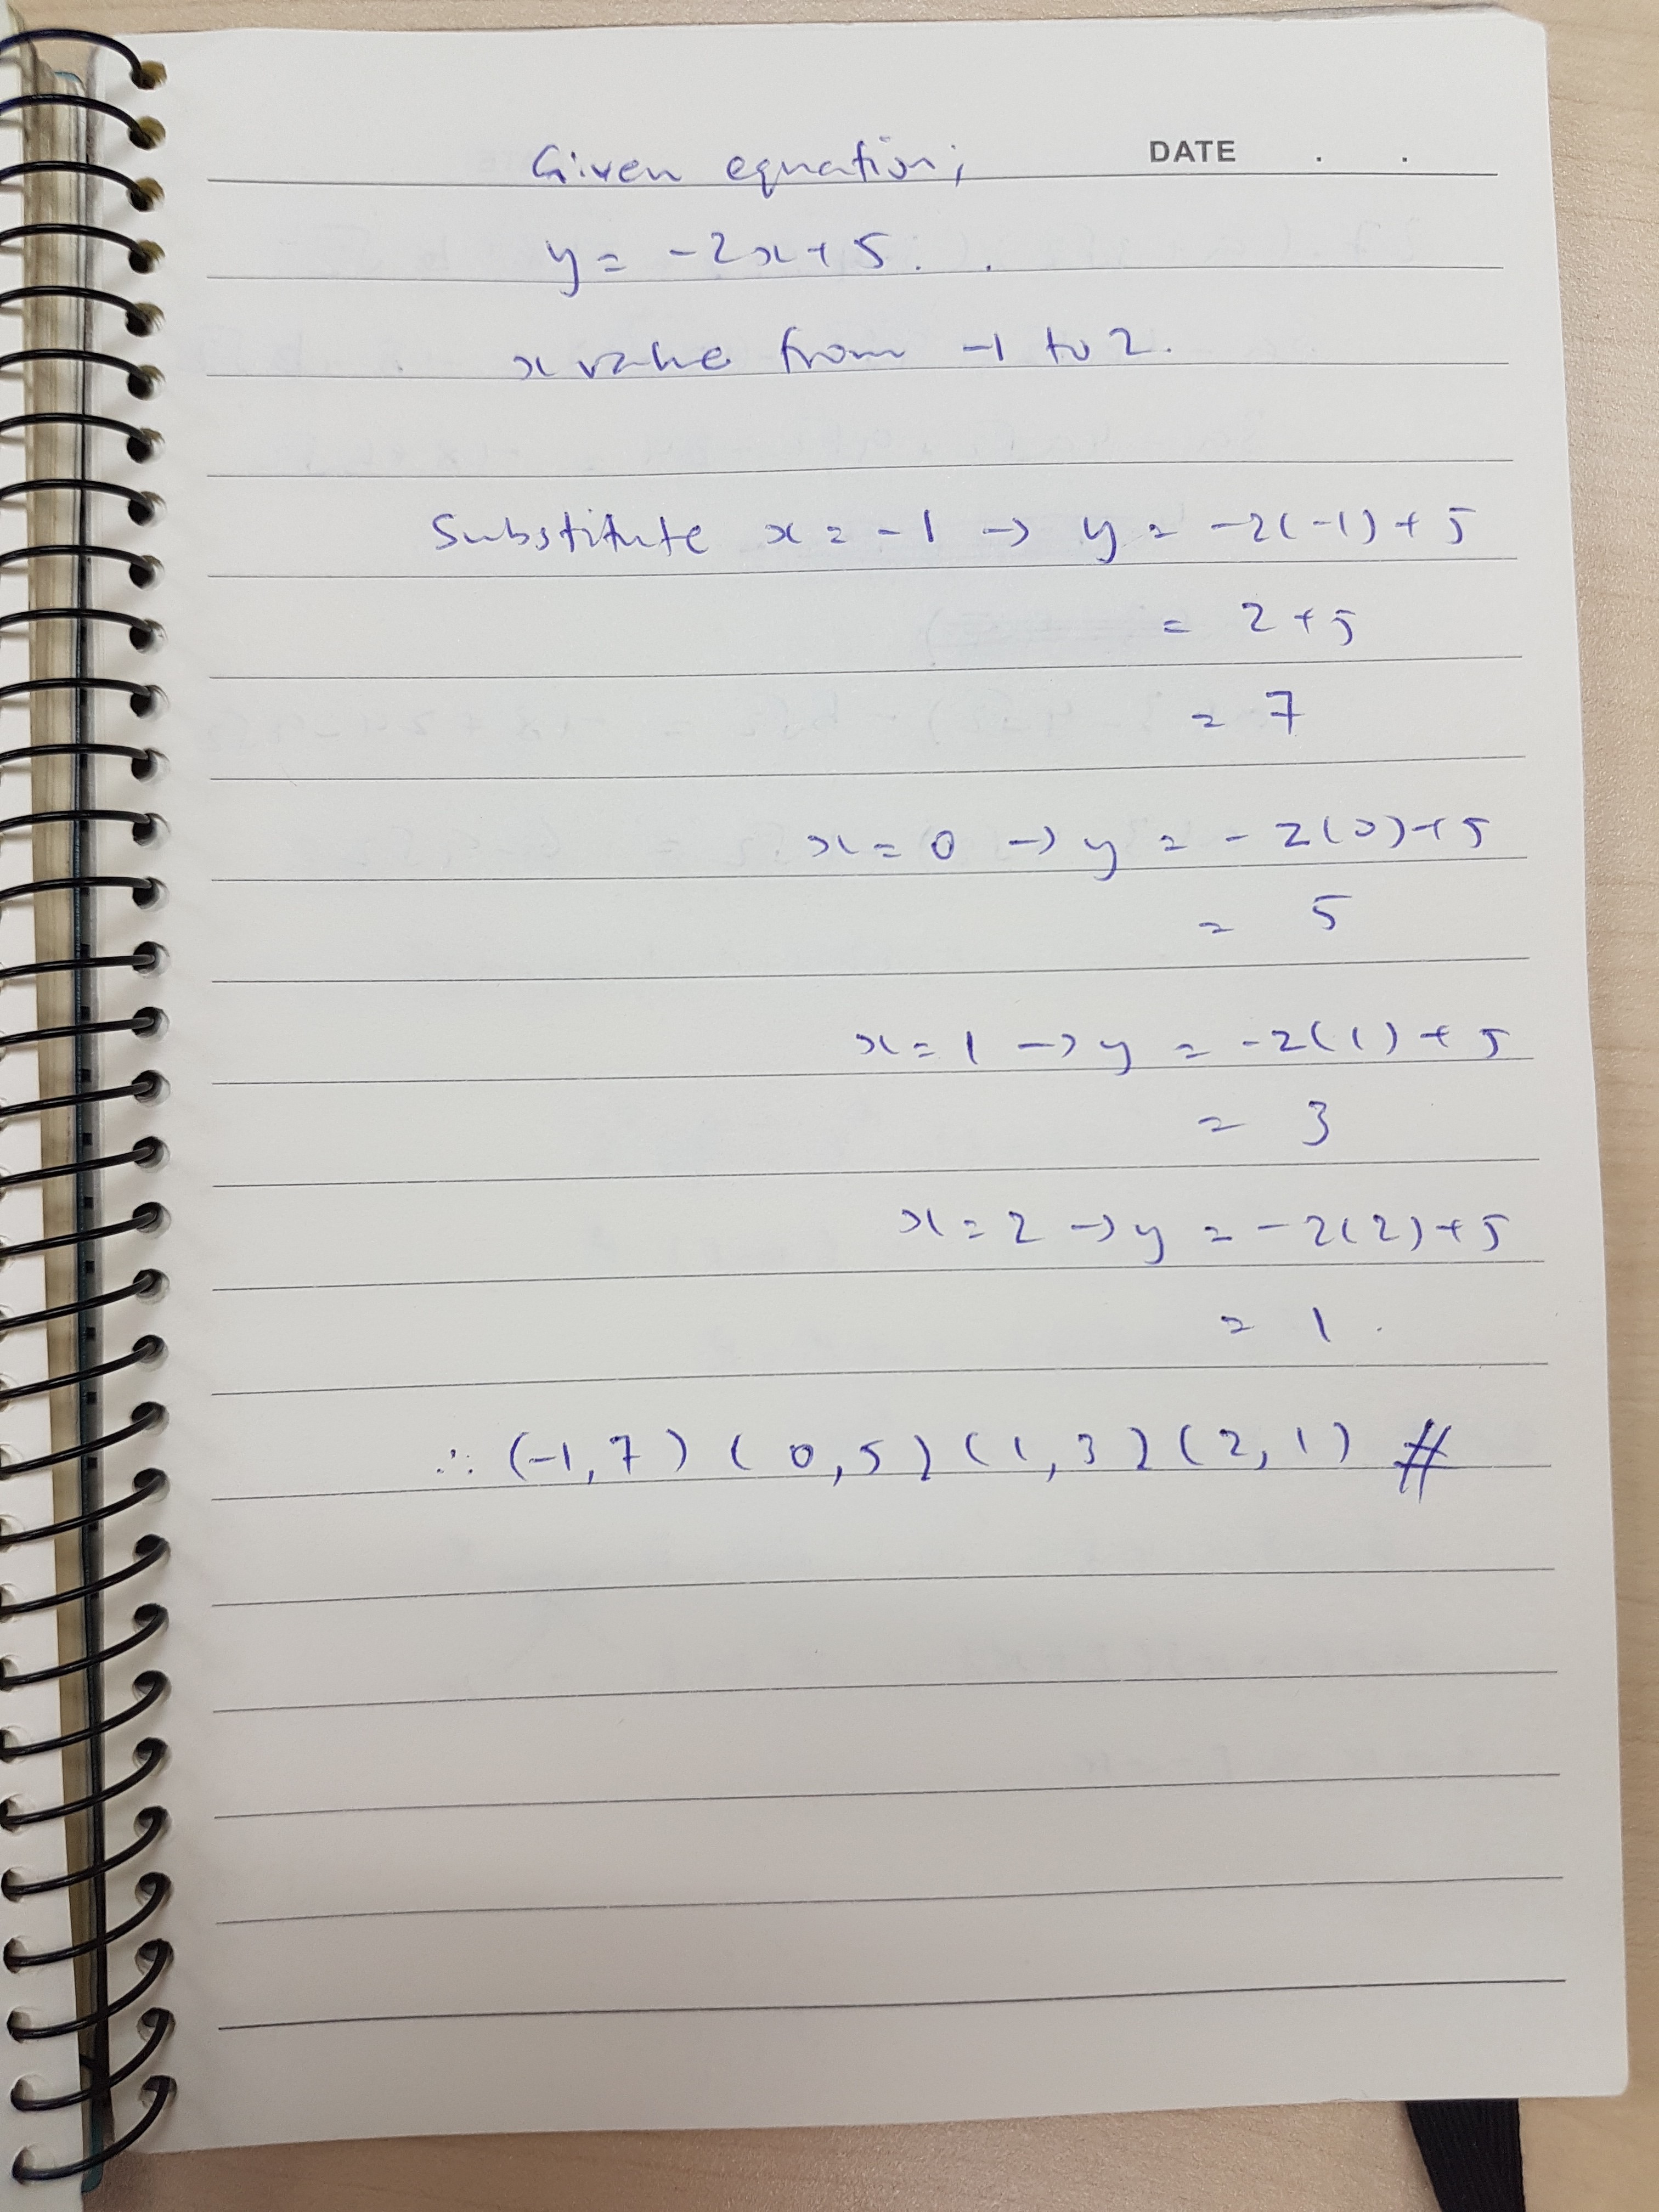
By substituting x values -1,0,1,2 into y equation.
Hope this helps! :)
Hope this helps! :)
Date Posted:
7 years ago
done
{{ upvoteCount }} Upvotes
clear
{{ downvoteCount * -1 }} Downvotes
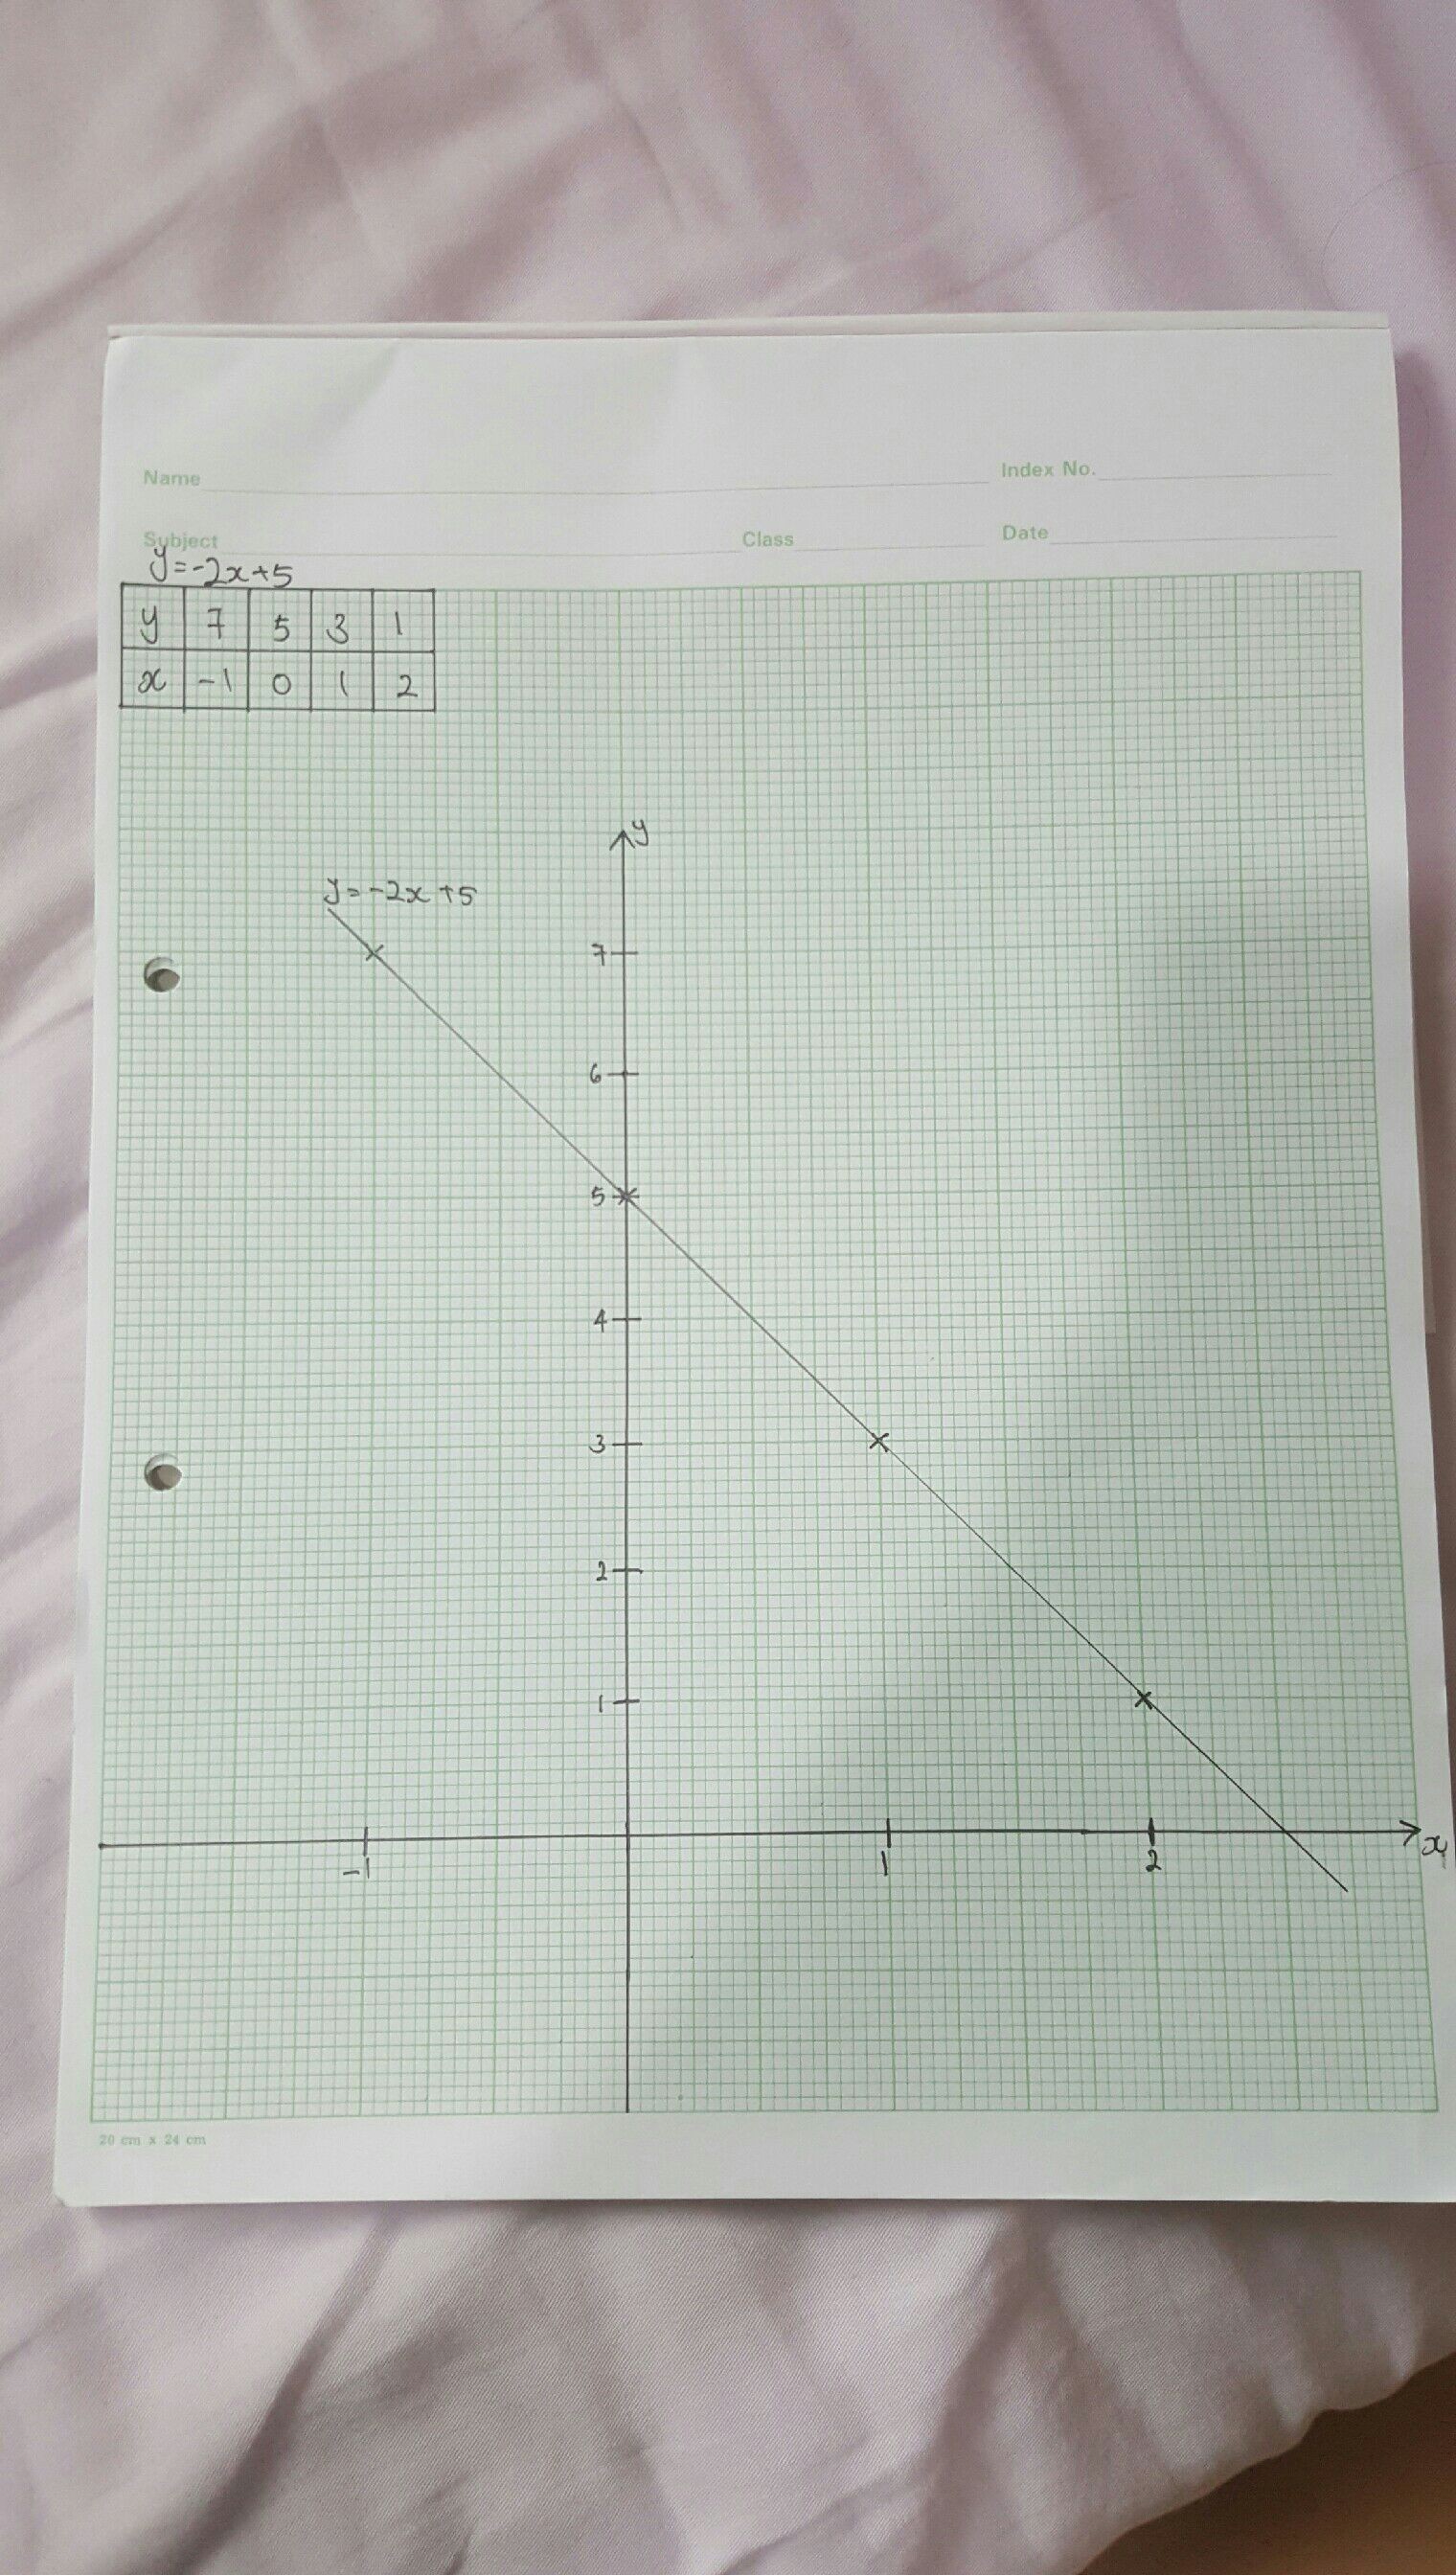
Since the range has been given, use it to plot the graph based on the formula
Date Posted:
7 years ago
done
{{ upvoteCount }} Upvotes
clear
{{ downvoteCount * -1 }} Downvotes

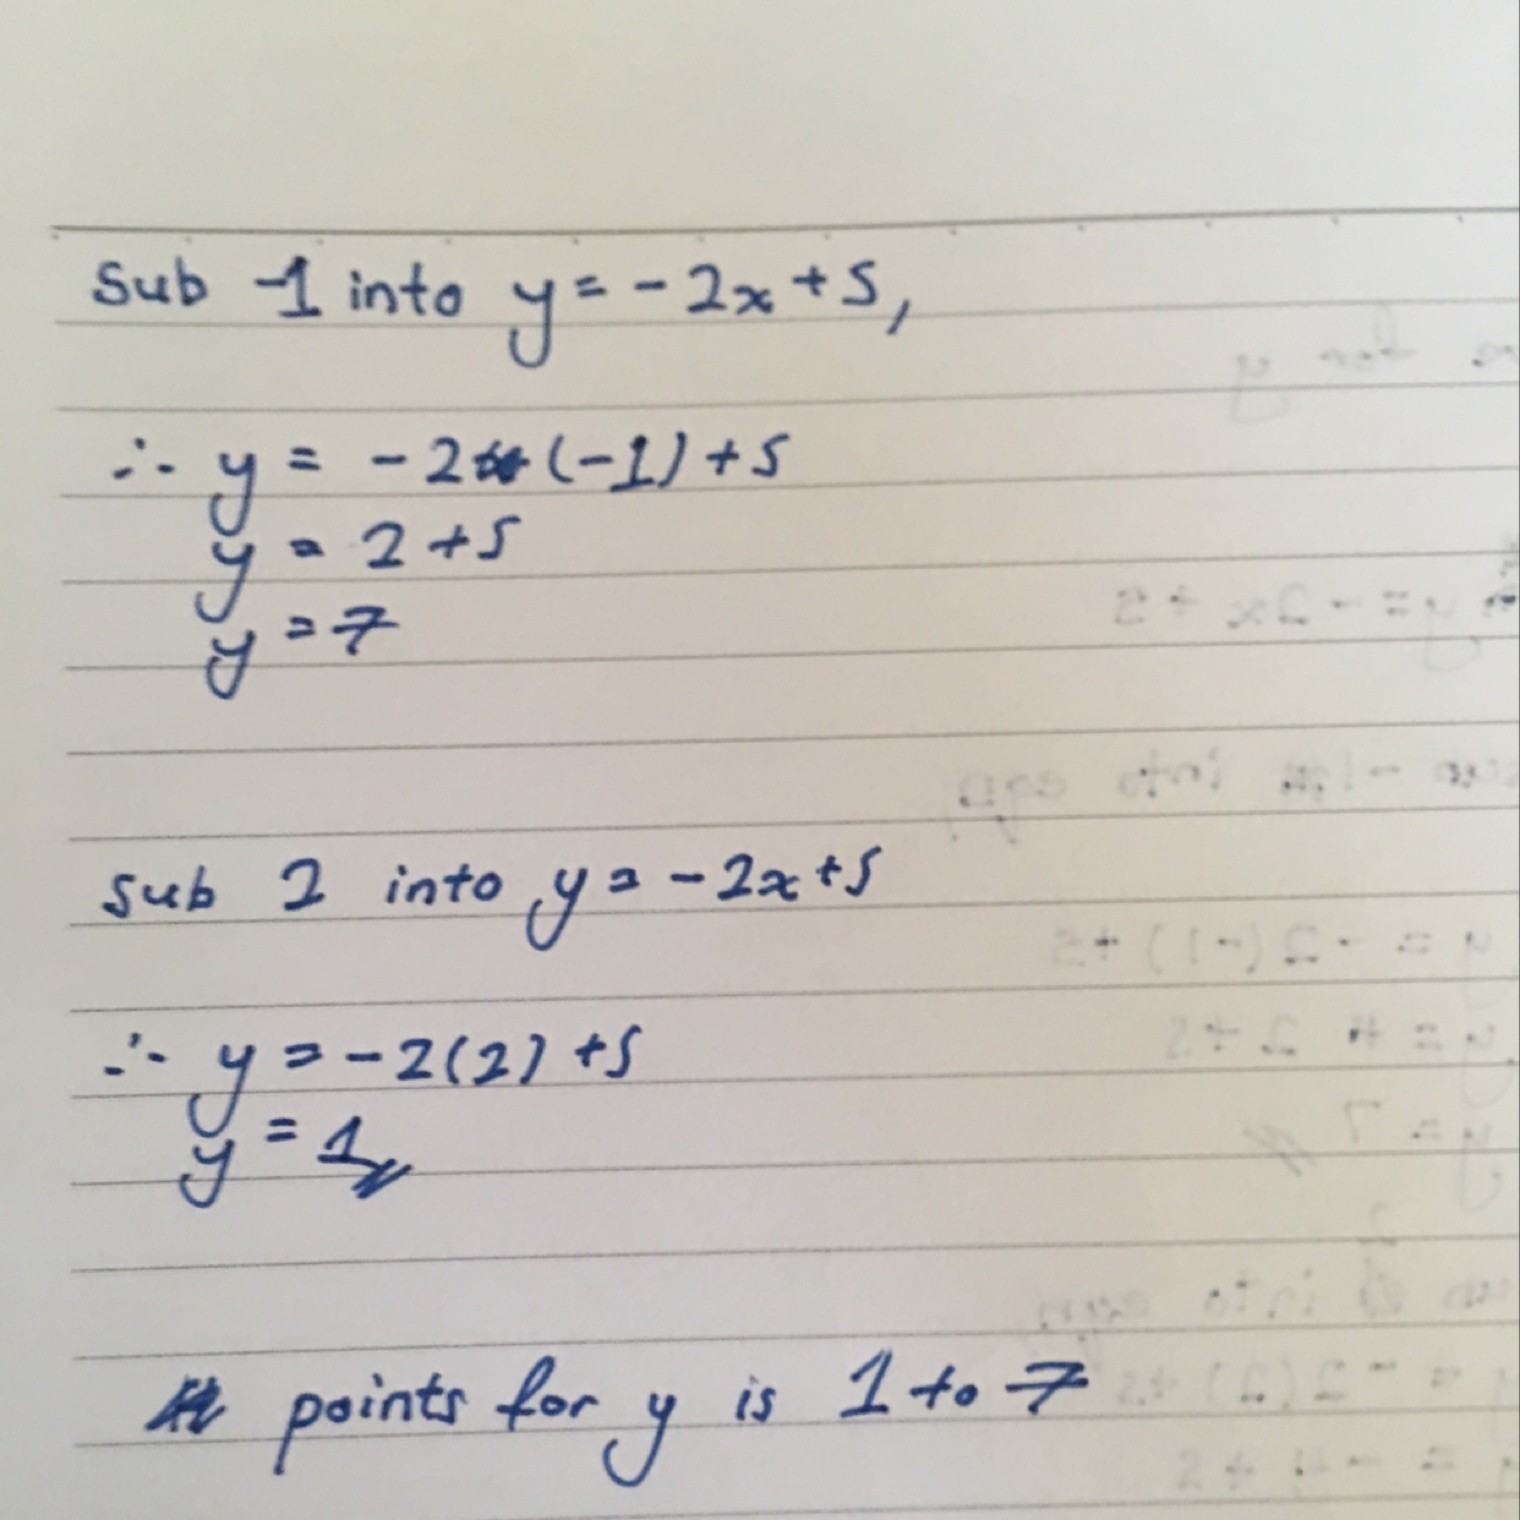
Since you are given the values for 'x' sub in the large and smallest values to find the large and smallest values for 'y' which will be 1 and 7, good luck mate
Date Posted:
7 years ago