Ask Singapore Homework?
Upload a photo of a Singapore homework and someone will email you the solution for free.

Question
secondary 3 | A Maths
2 Answers Below
Anyone can contribute an answer, even non-tutors.

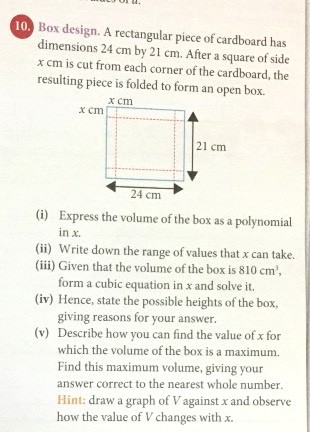
Help with ii pls tks
Date Posted: 4 years ago
Views: 190
See 2 Answers
done
{{ upvoteCount }} Upvotes
clear
{{ downvoteCount * -1 }} Downvotes

Here
Date Posted:
4 years ago
Could you help me with (v) too? Tks!
This I will look at it very late at night (if I can still remember) as I am occupied the entire day. The idea is to sketch a graph on graph paper.
This was very similar to an O Level exam question two years ago (2018).
This was very similar to an O Level exam question two years ago (2018).
For part iii, I will leave this for you to solve the cubic equation on your own. Should there be no integer value, if you are using Casio fx 96 sg plus, you can use MODE --> 3 --> 4 for cubic equation solving.
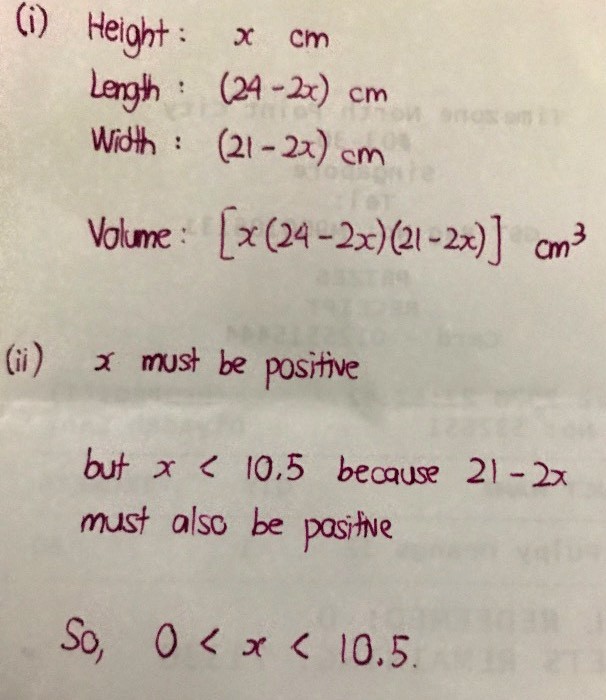
Part iv is just a plain read-off from part iii. We just have to make sure that x lies between 0 and 10.5.
For part v, we simply do the plain old school way of graph plotting.
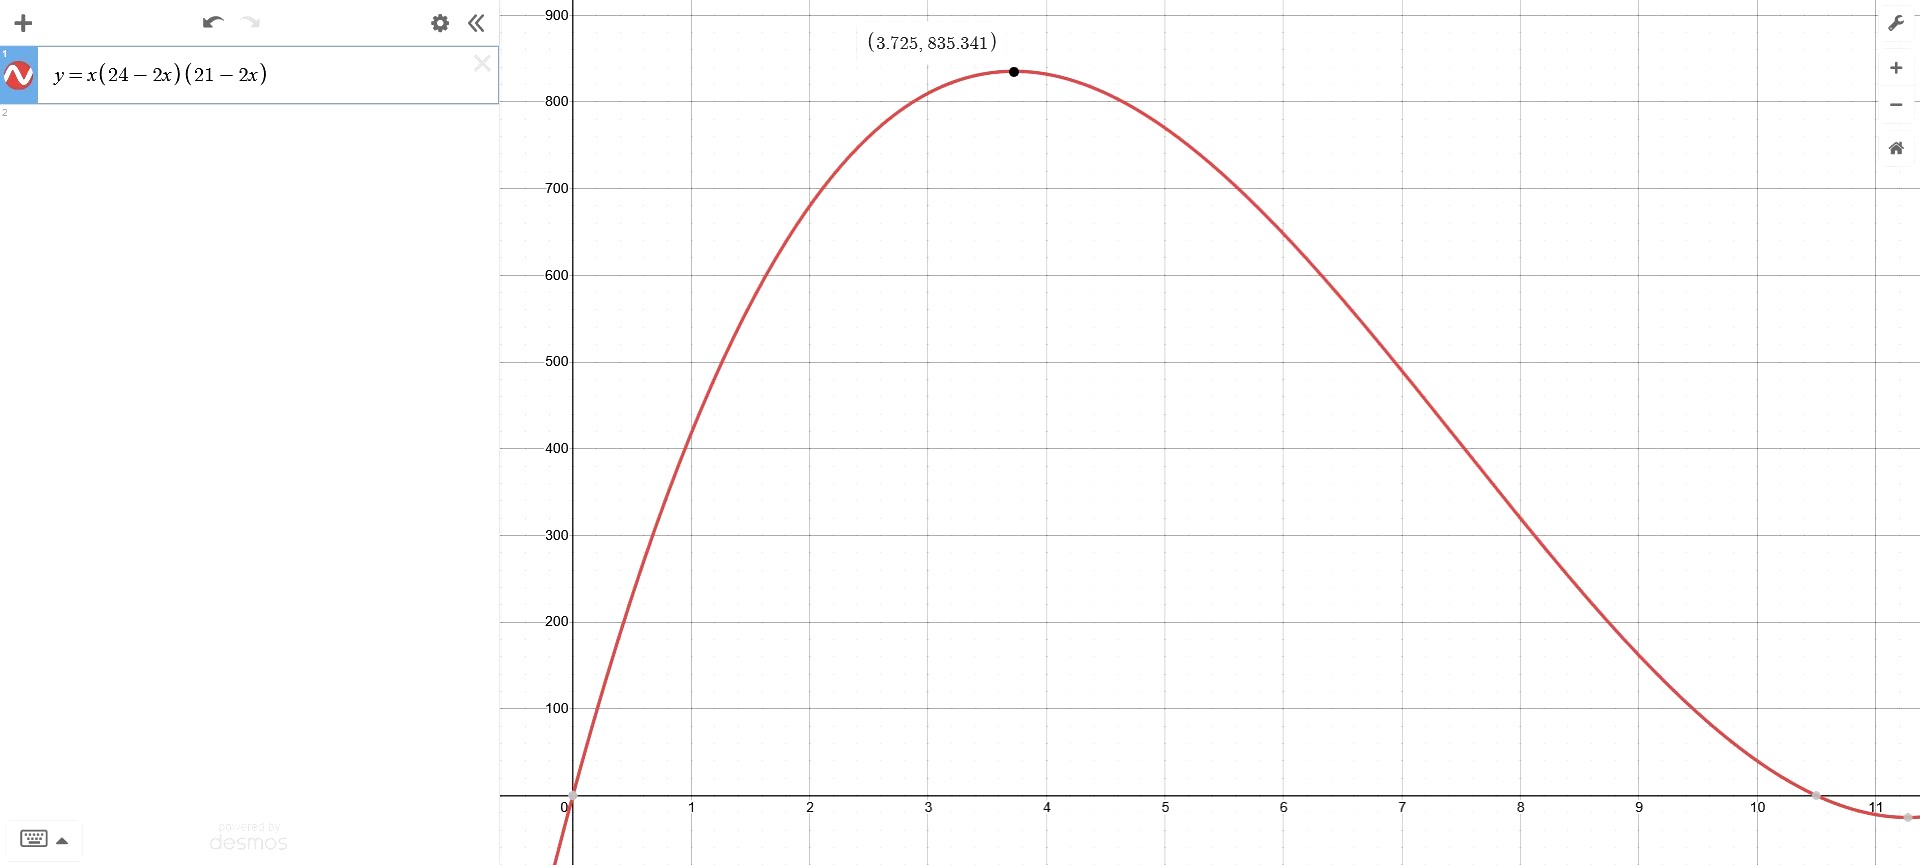
In other words, we plot the graph of V = x (24 - 2x)(21 - 2x) for 0 < x < 10.5. It's tedious, but the one with the least level of knowledge required. We set values of x such as 0, 0.5, 1, 1.5, ..., 10.5 and find the corresponding values of V, before plotting these coordinates on a graph paper and connecting them with a smooth curve.
The highest point on the graph will be the greatest volume of the box. One value of x will give this greatest volume of the box.
I will plot the graph on Desmos next.
Part iv is just a plain read-off from part iii. We just have to make sure that x lies between 0 and 10.5.
For part v, we simply do the plain old school way of graph plotting.
In other words, we plot the graph of V = x (24 - 2x)(21 - 2x) for 0 < x < 10.5. It's tedious, but the one with the least level of knowledge required. We set values of x such as 0, 0.5, 1, 1.5, ..., 10.5 and find the corresponding values of V, before plotting these coordinates on a graph paper and connecting them with a smooth curve.
The highest point on the graph will be the greatest volume of the box. One value of x will give this greatest volume of the box.
I will plot the graph on Desmos next.
done
{{ upvoteCount }} Upvotes
clear
{{ downvoteCount * -1 }} Downvotes
As requested.
Plotting the graph on graph paper should get you a curve which looks like this.
The only other method in your secondary maths syllabus, which can solve this other question (by a non-graphical method), is by differentiation, which you will only learn in Sec 4 A Maths. As such, I will not do them here.
Date Posted:
4 years ago