Ask Singapore Homework?
Upload a photo of a Singapore homework and someone will email you the solution for free.

Question
secondary 3 | E Maths
2 Answers Below
Anyone can contribute an answer, even non-tutors.

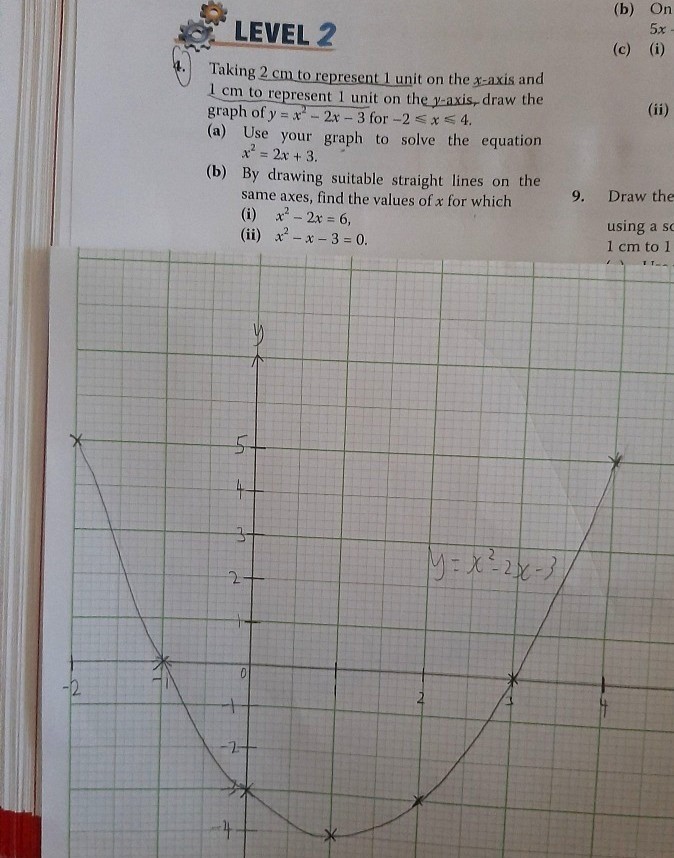
Can someone please help me with qns 4? I dont understand how to manipulate the equation to solve the graph graphically with the given equation. Can someone show me how to get the answer and explaining how you manipulate the equation by getting the answer?
Date Posted: 4 years ago
Views: 291
See 2 Answers
done
{{ upvoteCount }} Upvotes
clear
{{ downvoteCount * -1 }} Downvotes

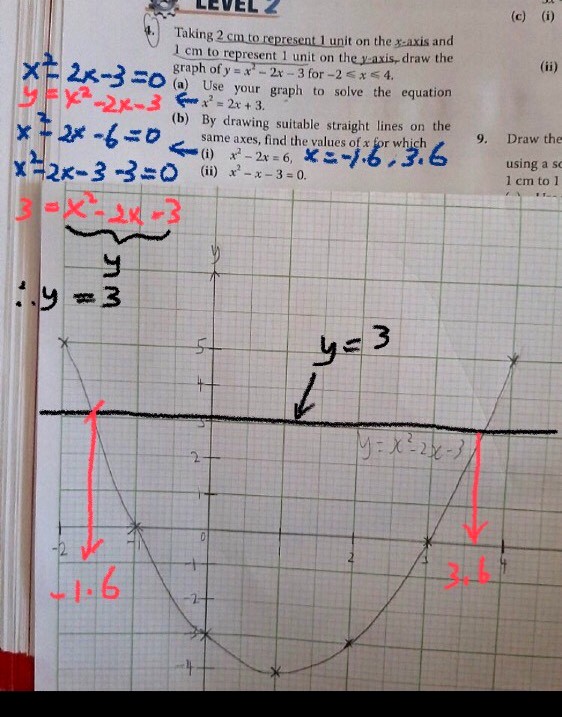
b i) answer... Hope this helps.
Date Posted:
4 years ago
Dont mind me asking but why did you bring the number 3 over ?
Why did x²-2x-6 become X²-2x-3-3=0?
Your graph is x²-2x-3, so we made this to x²-2x-3=3
done
{{ upvoteCount }} Upvotes
clear
{{ downvoteCount * -1 }} Downvotes
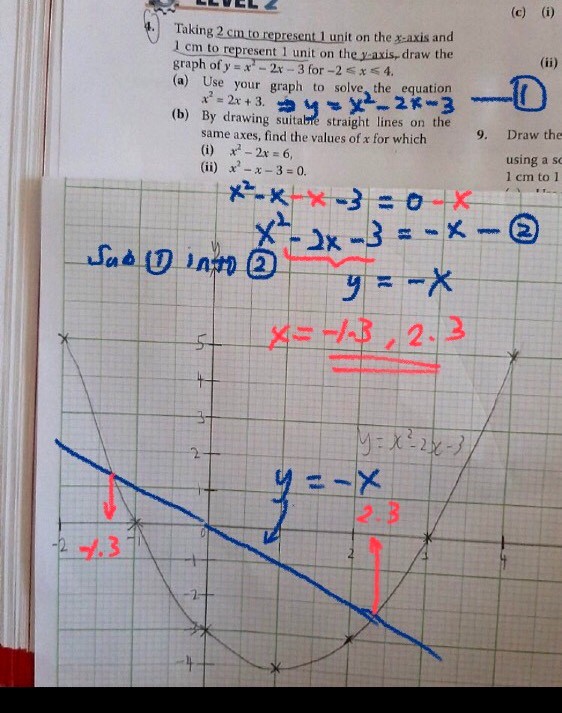
This is the other tutor explanation. Draw the y=-x line and find x when the two line and graph intercept. Hope this helps
Date Posted:
4 years ago
I don't understand...
4a, so what is the anwer for x? I dont understand how the other tutor manipulate the equation.... and how he even did it
Thats the only part which im confuse
4a answer x= -1 and 3 .
To get this answer, y=0 which is same as x- axis.... The graph crossed at x-axis at -1 and 3.
To work out x.
x²= 2x+3
x²-2x-3=0
For graph, y=...........
For this y = x²-2x-3 so, y=0
To get this answer, y=0 which is same as x- axis.... The graph crossed at x-axis at -1 and 3.
To work out x.
x²= 2x+3
x²-2x-3=0
For graph, y=...........
For this y = x²-2x-3 so, y=0
Ohh i think i get it now! Thank u
Sorry i dont think i understand 4bii, why is the line drawn like that? Is it possible to anyhow draw the line as long as it passes through y,0?
For 4bii.
y=-x
Tabulate the table
Y -2 -1 0 1 2
X 2 1 0 -1 -2
Plot the graph base on above value.
i.e y= -x line. Hope this helps.
y=-x
Tabulate the table
Y -2 -1 0 1 2
X 2 1 0 -1 -2
Plot the graph base on above value.
i.e y= -x line. Hope this helps.