Ask Singapore Homework?
Upload a photo of a Singapore homework and someone will email you the solution for free.

Question
secondary 3 | E Maths
One Answer Below
Anyone can contribute an answer, even non-tutors.

I am unable to explain this question :( Pls help. Thanks.
Date Posted: 4 years ago
Views: 339

Good evening Candice! I will explain this situation when I return at 3 am. Idea: a ball falling from a height and then hit the floor and bounce off.
The sudden change in the direction of the hall explains the discontinuity.
The sudden change in the direction of the hall explains the discontinuity.
Good evening Mr Eric. Thanks for looking into this question :)
Hang on, it’s not as simple as a basketball situation. Did not see that it’s an acceleration time graph AND the acceleration at the end is -1. The change in acceleration from positive to negative is basically something which tries to accelerate quickly and suddenly goes in the opposite direction eg I intend to wreck a vehicle and attempt to crash it, not realising that it will accelerate in the opposite direction.
I believe that there is no physical phenomena which can describe this motion.
Will draw the graph later.
I believe that there is no physical phenomena which can describe this motion.
Will draw the graph later.
See 1 Answer
done
{{ upvoteCount }} Upvotes
clear
{{ downvoteCount * -1 }} Downvotes
Good evening Candice! This one is quite tough and I expect you to have some questions for me regarding my working. If you have some Sec 3 Physics background, this should be slightly easier to understand due to terminologies seen in the kinematics topic in Physics.
Date Posted:
4 years ago
Thank you so much, Mr Eric. I will run through your advised working solution.
Yes, I might have to trouble you to explain more if I don't understand. Thanks again :)
Yes, I might have to trouble you to explain more if I don't understand. Thanks again :)
Good afternoon Mr Eric, I have 4 questions that need your advice.
Qn#1: Why is the acceleration when the car brakes negative? (If your analogy is applied here)
Qn#2: Does the direction in which the car is slowing down in matter since acceleration is a vector quantity?
Qn#3: How do you determine which part of the downward curve is in the positive or negative terrains of the velocity-time graph?
Qn#4: Why is the velocity at t=3.5 negative?
Good afternoon Candice!
1. As a car brakes, it experiences a sudden slowing down from a certain speed. When this happens, it takes only a matter of moments (0.1 seconds) before the speed decreases by a lot. This goes for a very short duration before the vehicle finally reaches a desired speed (zero or just a slowing down). As such, there is deceleration involved due to a decrease in speed, which would become more gradual as the car slows down to the desired speed. A car would be a good example here as the deceleration is sudden.
2. Technically yes, although most of the time a car moves and decelerates in a single direction. A car would not be moving forward and suddenly find itself moving in the other direction. So the acceleration time graph is often well defined.
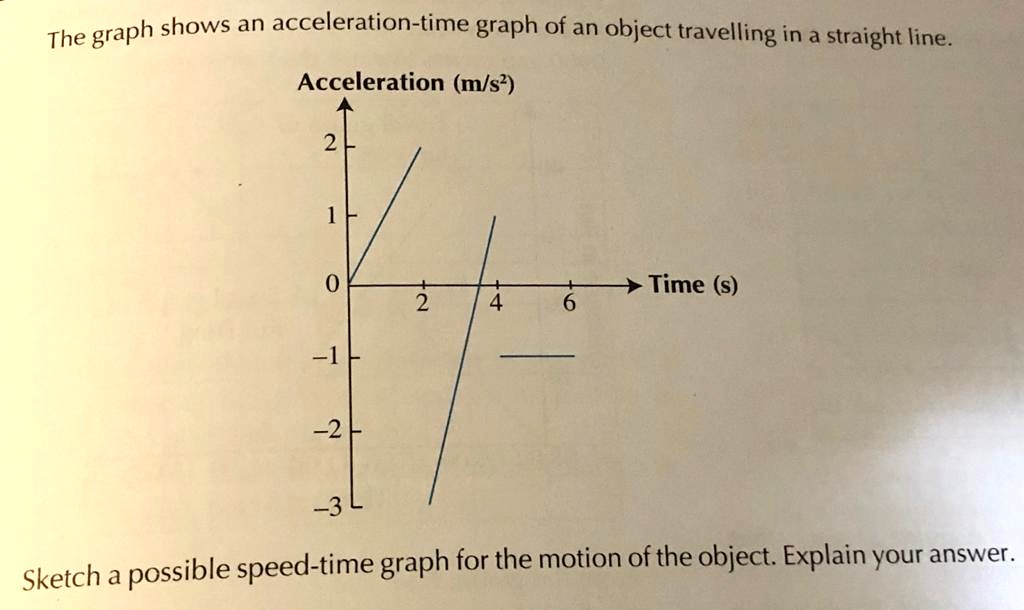
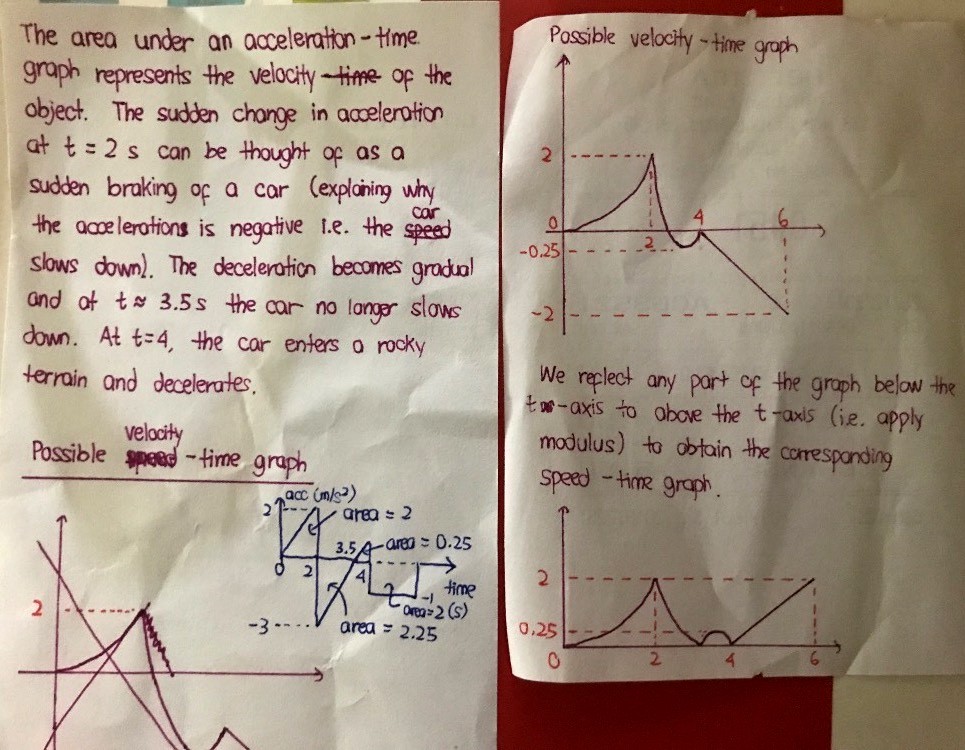
3. The area under the acceleration-time graph provides a numerical value for the velocity (not speed) of the car.
In the first two seconds, the car’s acceleration increases constantly from 0 m/s2 to 2 m/s2. The speed would increase in the manner I have drawn, up to a speed of 2 m/s which is the area of this triangle. Hence, at the 2 s mark the speed is 2 m/s.
A sudden deceleration defined by an area of 2.25 units (1/2 * 1.5 * 3) reduces the velocity by 2.25 m/s2 to a current value of -0.25 m/s at 3.5 s. At this point, the car does move backward (but in this case the car would be a bad example, as braking actions will not cause the car to move backwards).
The car then has a positive acceleration defined by a total area of 0.25 units over the next 0.5 seconds (1/2 * 0.5 * 1), bringing up the velocity to a perfect zero. Finally, the car’s velocity reduces by 2 m/s to a value of -2 m/s at 6 s.
In general, areas above the graph will be counted as positive, while areas under a graph will be counted as negative. They cancel each other out. You will see this in very great detail in Sec 4 A Maths under integration, where they also cover kinematics for non-linear motions.
4. The decrease from 2 m/s to -0.25 m/s from 2 s to 3.5 s makes the new velocity negative, as explained above. It just simply depends on whether an area below the t-axis is greater than the area above the t-axis or not.
Let me know if you are confused my my explanations and I will try and refine them again.
1. As a car brakes, it experiences a sudden slowing down from a certain speed. When this happens, it takes only a matter of moments (0.1 seconds) before the speed decreases by a lot. This goes for a very short duration before the vehicle finally reaches a desired speed (zero or just a slowing down). As such, there is deceleration involved due to a decrease in speed, which would become more gradual as the car slows down to the desired speed. A car would be a good example here as the deceleration is sudden.
2. Technically yes, although most of the time a car moves and decelerates in a single direction. A car would not be moving forward and suddenly find itself moving in the other direction. So the acceleration time graph is often well defined.
3. The area under the acceleration-time graph provides a numerical value for the velocity (not speed) of the car.
In the first two seconds, the car’s acceleration increases constantly from 0 m/s2 to 2 m/s2. The speed would increase in the manner I have drawn, up to a speed of 2 m/s which is the area of this triangle. Hence, at the 2 s mark the speed is 2 m/s.
A sudden deceleration defined by an area of 2.25 units (1/2 * 1.5 * 3) reduces the velocity by 2.25 m/s2 to a current value of -0.25 m/s at 3.5 s. At this point, the car does move backward (but in this case the car would be a bad example, as braking actions will not cause the car to move backwards).
The car then has a positive acceleration defined by a total area of 0.25 units over the next 0.5 seconds (1/2 * 0.5 * 1), bringing up the velocity to a perfect zero. Finally, the car’s velocity reduces by 2 m/s to a value of -2 m/s at 6 s.
In general, areas above the graph will be counted as positive, while areas under a graph will be counted as negative. They cancel each other out. You will see this in very great detail in Sec 4 A Maths under integration, where they also cover kinematics for non-linear motions.
4. The decrease from 2 m/s to -0.25 m/s from 2 s to 3.5 s makes the new velocity negative, as explained above. It just simply depends on whether an area below the t-axis is greater than the area above the t-axis or not.
Let me know if you are confused my my explanations and I will try and refine them again.
Wow! Thumbs up ! I really appreciate your effort and time in addressing my doubts. Thank you so much, Mr Eric.:)