Ask Singapore Homework?
Upload a photo of a Singapore homework and someone will email you the solution for free.

Question
secondary 4 | A Maths
One Answer Below
Anyone can contribute an answer, even non-tutors.

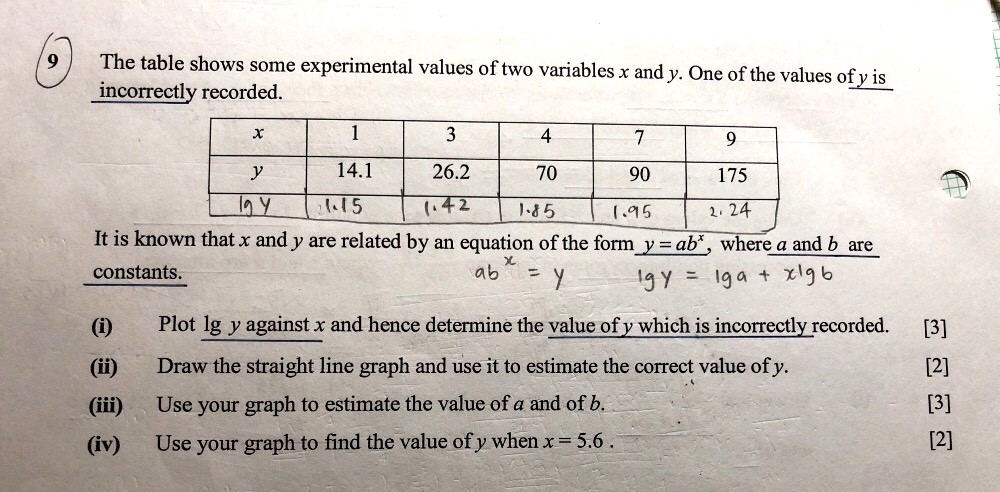
Can anybody help me plot this graph? Because I can’t seem to find a correct y-axis scale..
Date Posted: 4 years ago
Views: 437

The ln y axis set as 0 to 2.4. This is because we need some leeway for the x value to go to 0. By eye inspection, the ln y value is between 0.5 and 1 when x = 0.
There are around 24 small squares in the vertical direction, so a good scale to use is 2 cm to represent 0.2 units in the ln y direction.
There are around 24 small squares in the vertical direction, so a good scale to use is 2 cm to represent 0.2 units in the ln y direction.
Thank you so much!
See 1 Answer
done
{{ upvoteCount }} Upvotes
clear
{{ downvoteCount * -1 }} Downvotes
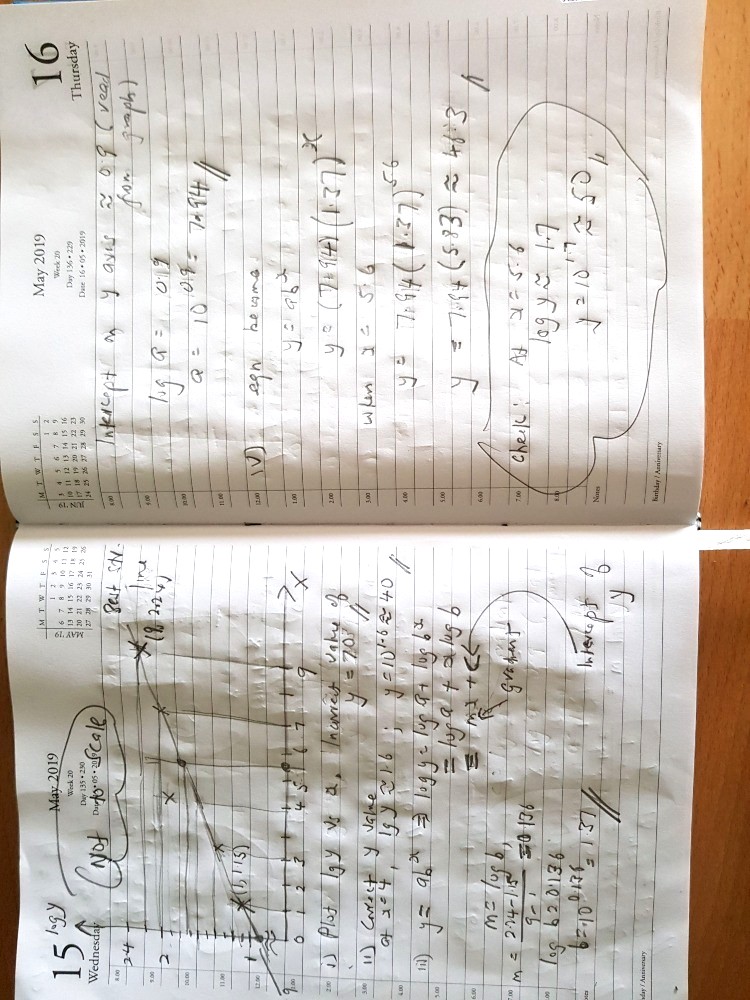
Graph is not drawn to scale. Redraw the graph. Follow my steps to get more accurate answers.
Date Posted:
4 years ago
Thank you!!!