Ask Singapore Homework?
Upload a photo of a Singapore homework and someone will email you the solution for free.

Question
secondary 4 | A Maths
2 Answers Below
Anyone can contribute an answer, even non-tutors.

Help
Date Posted: 5 years ago
Views: 411
See 2 Answers
done
{{ upvoteCount }} Upvotes
clear
{{ downvoteCount * -1 }} Downvotes

Hope this helps.
Date Posted:
5 years ago

For this kind of question we must actually draw the 'best-fit' line, so it may not be wise to use two random points to start a line. This line may not even pass through any of the four data points.
Graphing software beats all forms of manual drawing hands down in terms of the accuracy of the numbers obtained.
Graphing software beats all forms of manual drawing hands down in terms of the accuracy of the numbers obtained.
Erm.. For 'scattered points', yes, there will be a need to plot all e points for a best fit line. But for this question, since this is a linear graph to begin wif, ie gradient is constant, my opinion is, 2 points (usually i take e furthest apart points) will do.
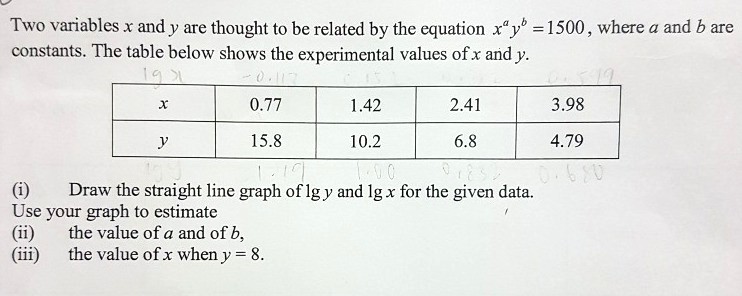
a lg x + b lg y = lg1500
Take lg x to be p and lg y to be q.
ap+ bq = constant
bq = constant - ap
q= constant /b - a/b (p)
Since we plot p against q, this is akin to a typical y=mx + c graph (a and b being constants) ie a linear graph so only 2 points needed.
But dats juz my opinion :)
a lg x + b lg y = lg1500
Take lg x to be p and lg y to be q.
ap+ bq = constant
bq = constant - ap
q= constant /b - a/b (p)
Since we plot p against q, this is akin to a typical y=mx + c graph (a and b being constants) ie a linear graph so only 2 points needed.
But dats juz my opinion :)
Should be scattered for such lines (but should not be that scattered, or linear fits would be poor; such lines should have a correlation coefficient better than a magnitude of 0.99).
The values obtained (x and y) are probably ‘estimates’ or ‘approximations’ and are not exact. Take for example x = 0.77 and y = 15.8. I doubt there is an exact combination which x^a y^b will equal to a perfect 15, so x and y should be slightly off (I mean ln x and ln y when it comes to the plotting).
The values obtained (x and y) are probably ‘estimates’ or ‘approximations’ and are not exact. Take for example x = 0.77 and y = 15.8. I doubt there is an exact combination which x^a y^b will equal to a perfect 15, so x and y should be slightly off (I mean ln x and ln y when it comes to the plotting).
Er.. Plotting lg x against lg y definitely a linear graph mathematically (proof already shown in earlier comment).. E only issue is the values of y (how accurate it can be), lg x and lg y are subject to roundings which will affect results and hand drawn graphs as well. By all means use all e points, but i still opined it is unnecessary for this qn.....
But i get ur point abt forming a correlation between x and y being 'guesstimates' since the values are derived experimentally. I am just focusing on e mathematical aspect and not e practical, real world aspect :)
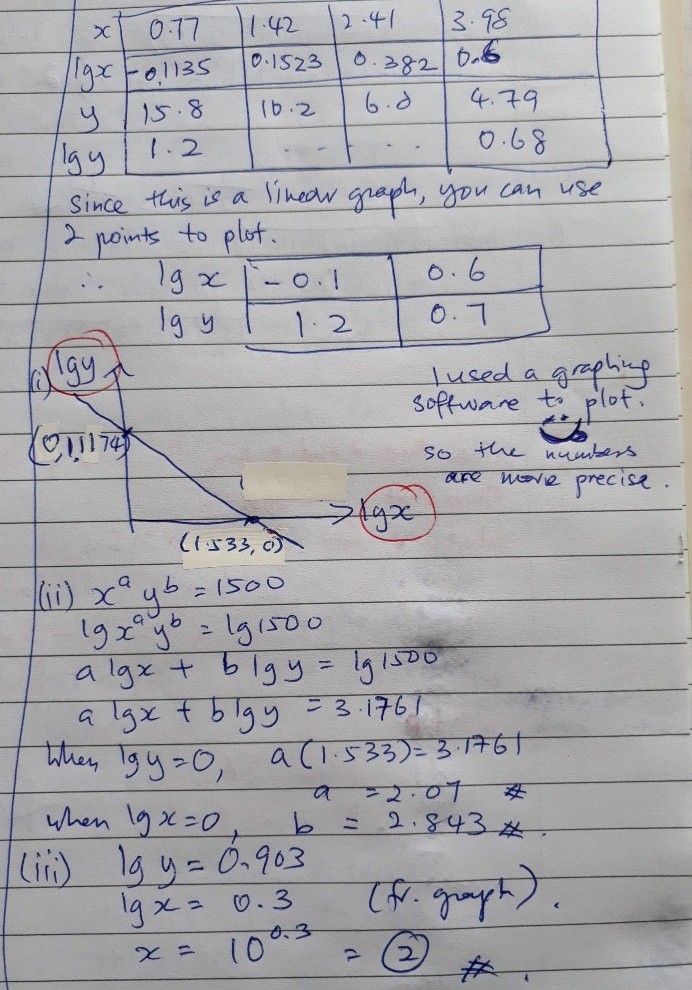
I tried to plot a graph for this question. Sadly, the best fit line did not pass through any of the four data points.
Strange... Using a graphing app, mine showed a straight line.. I also formed a linear equation wif e 2 furthest points n e other 2 points generally fit. Moreover, from the initial equation, it can be proven dat the lg functions are linearly related.
Actually wif e data given, qn can b resolved without e need for graphing. Underlying assumption is data are correct
Actually wif e data given, qn can b resolved without e need for graphing. Underlying assumption is data are correct
Hmm...perhaps it’s the scaling for the graphing app. Closer zoom in to the data points should result in some gap between the points and the fitted line. Or maybe my line is just terrible.
done
{{ upvoteCount }} Upvotes
clear
{{ downvoteCount * -1 }} Downvotes
My version of the graph. The image may or may not be clear.
Date Posted:
5 years ago