Ask Singapore Homework?
Upload a photo of a Singapore homework and someone will email you the solution for free.

Question
secondary 3 | Biology
One Answer Below
Anyone can contribute an answer, even non-tutors.

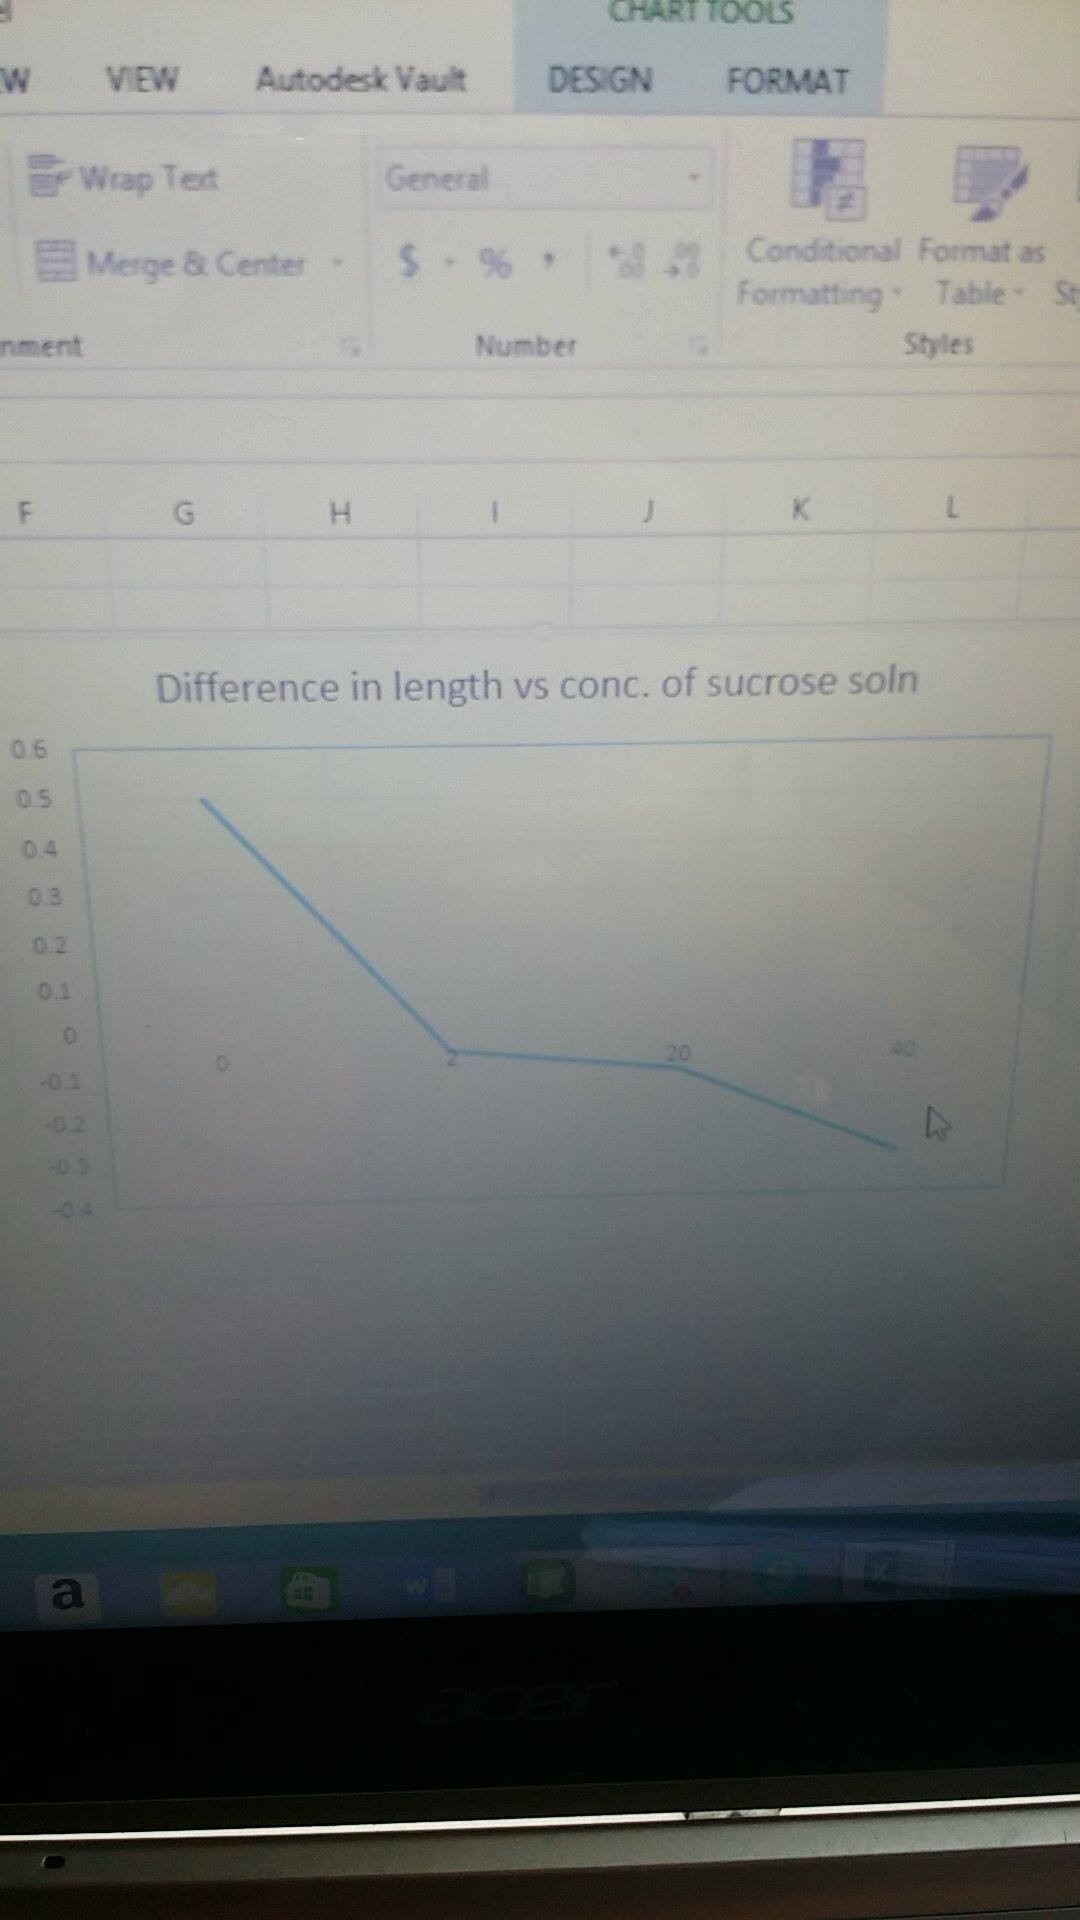
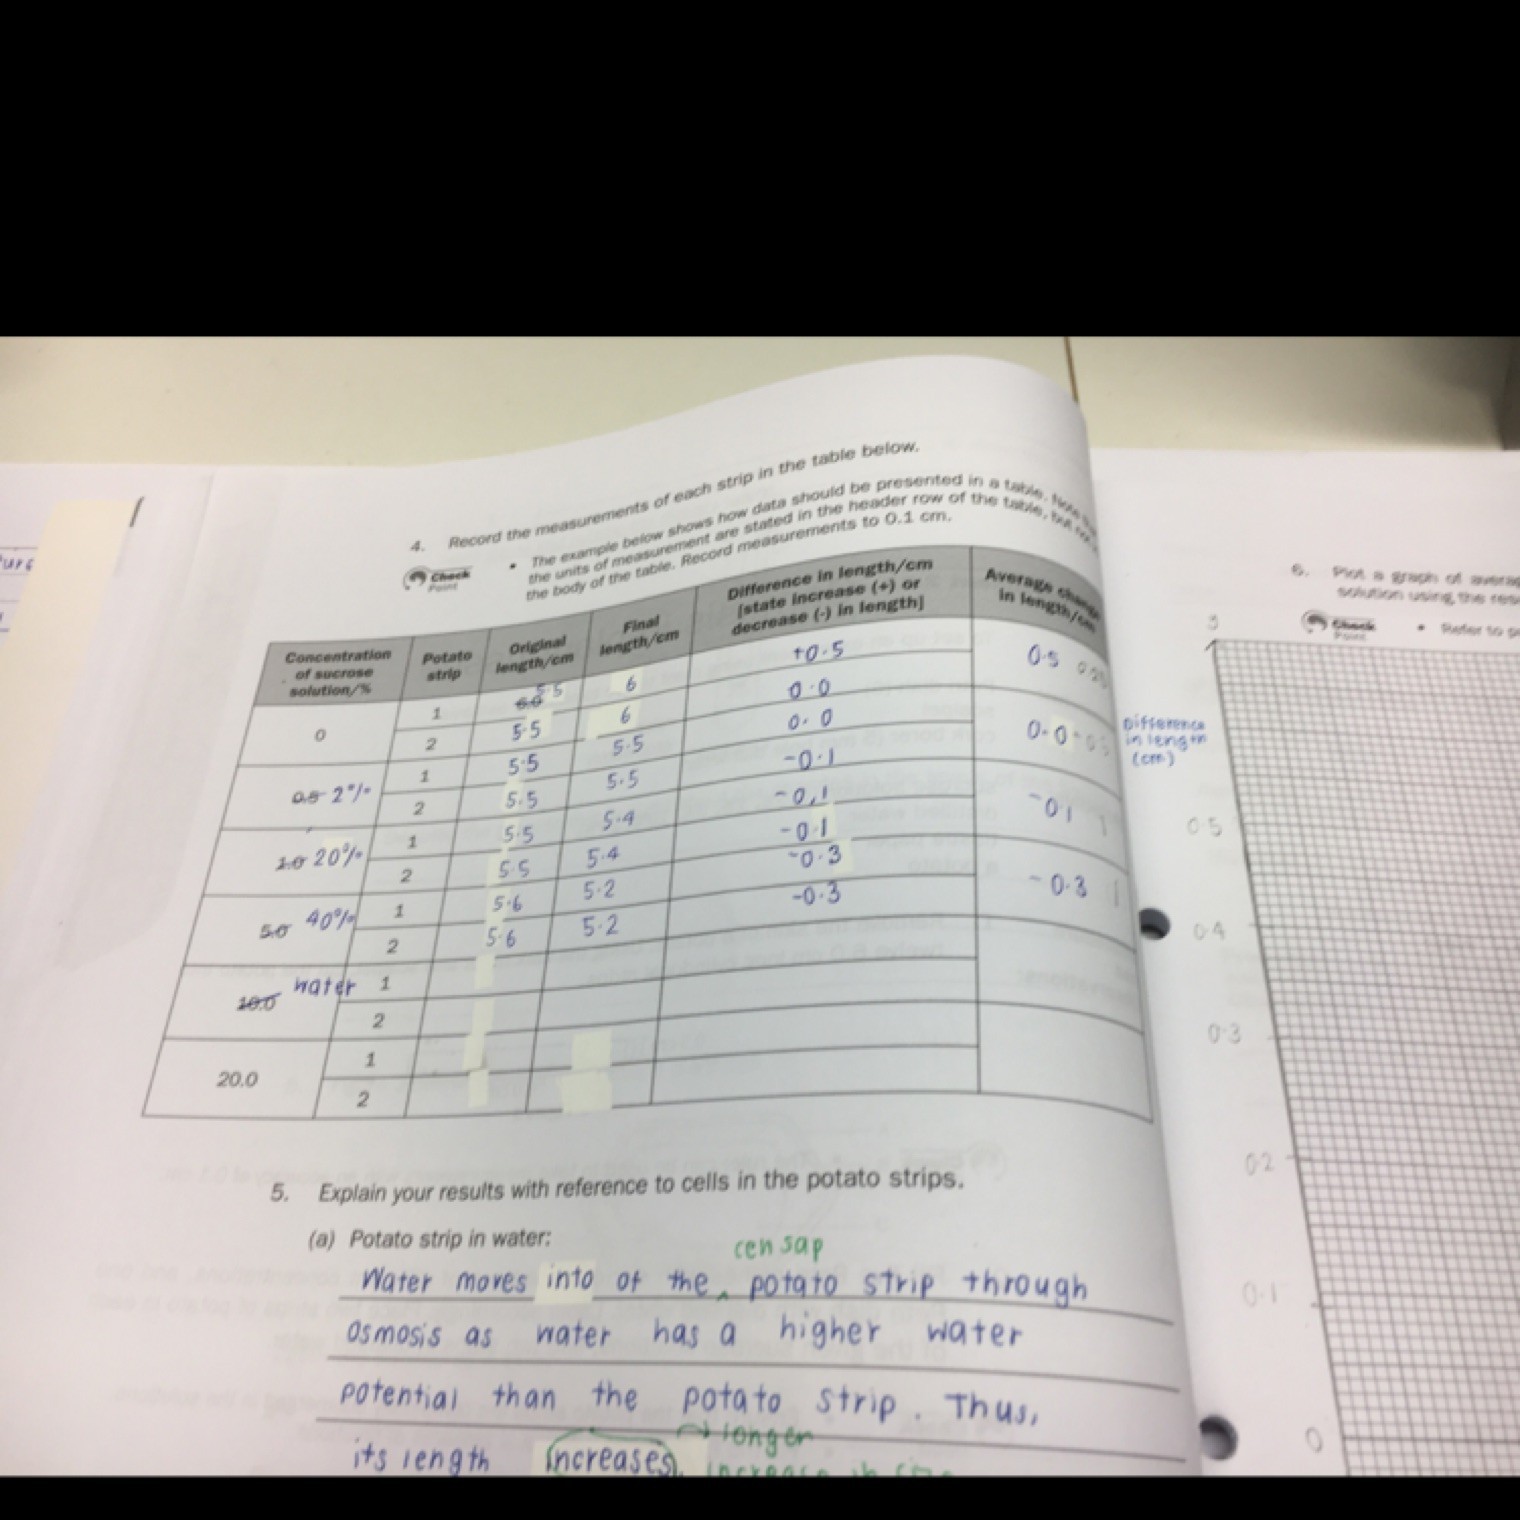
How do u plot a graph using these info with diff in length being y axis and conc of salt soln being x axis? Thks
Date Posted: 7 years ago
Views: 467
See 1 Answer