Ask Singapore Homework?
Upload a photo of a Singapore homework and someone will email you the solution for free.

See 3 Answers
done
{{ upvoteCount }} Upvotes
clear
{{ downvoteCount * -1 }} Downvotes

It is my answer. Correct, please!
Date Posted:
6 years ago
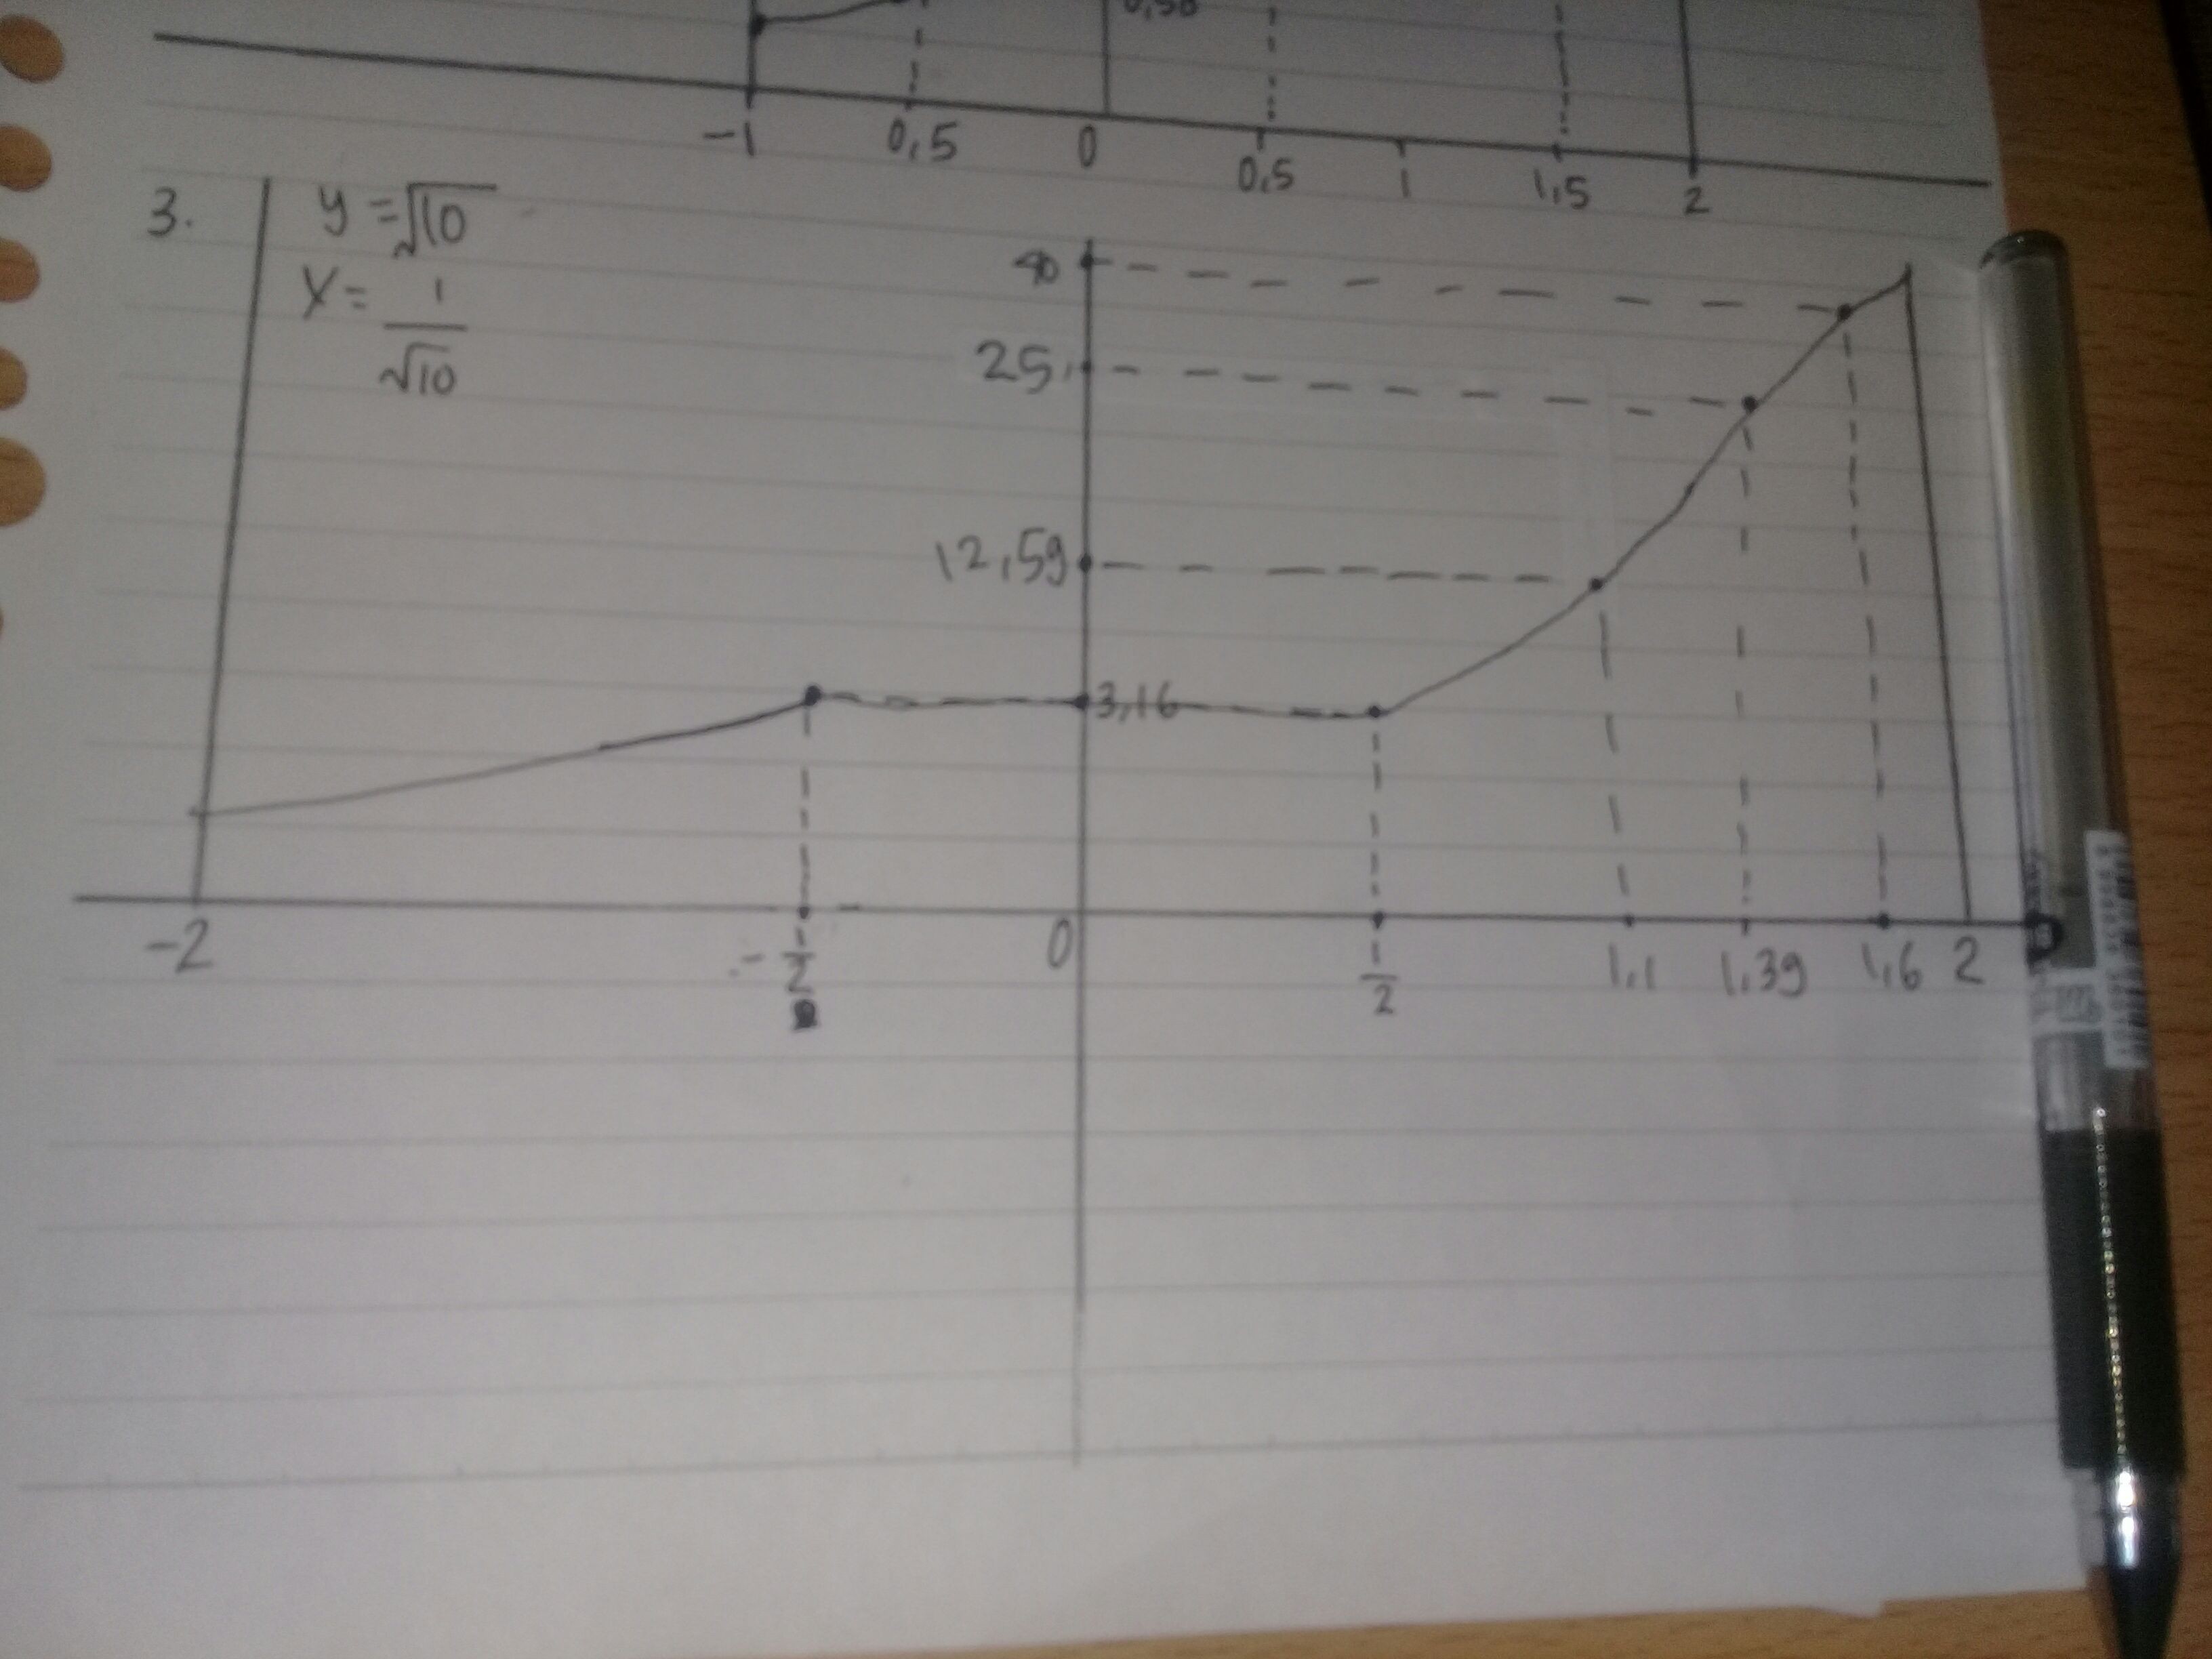
Why is your graph a flat line from -0.5
Hemm, Let's just say that -2 <_x <_2
No, between the interval I mentioned, why is your graph horizontal? The entire graph is supposed to be smooth and curved.
Can you give me your answer, please!
done
{{ upvoteCount }} Upvotes
clear
{{ downvoteCount * -1 }} Downvotes

Your answer could be simpler. First, draw the graph using x integer values from -2 to 2. Find corresponding y values. a, b and c require you to find y values by drawing vertical lines from the required x values. d and e require you to find x values by drawing horizontal lines from the required y values. Since you need to estimate the values, you need to draw the graph on a graph paper. I hope this helps.
Date Posted:
6 years ago
done
{{ upvoteCount }} Upvotes
clear
{{ downvoteCount * -1 }} Downvotes
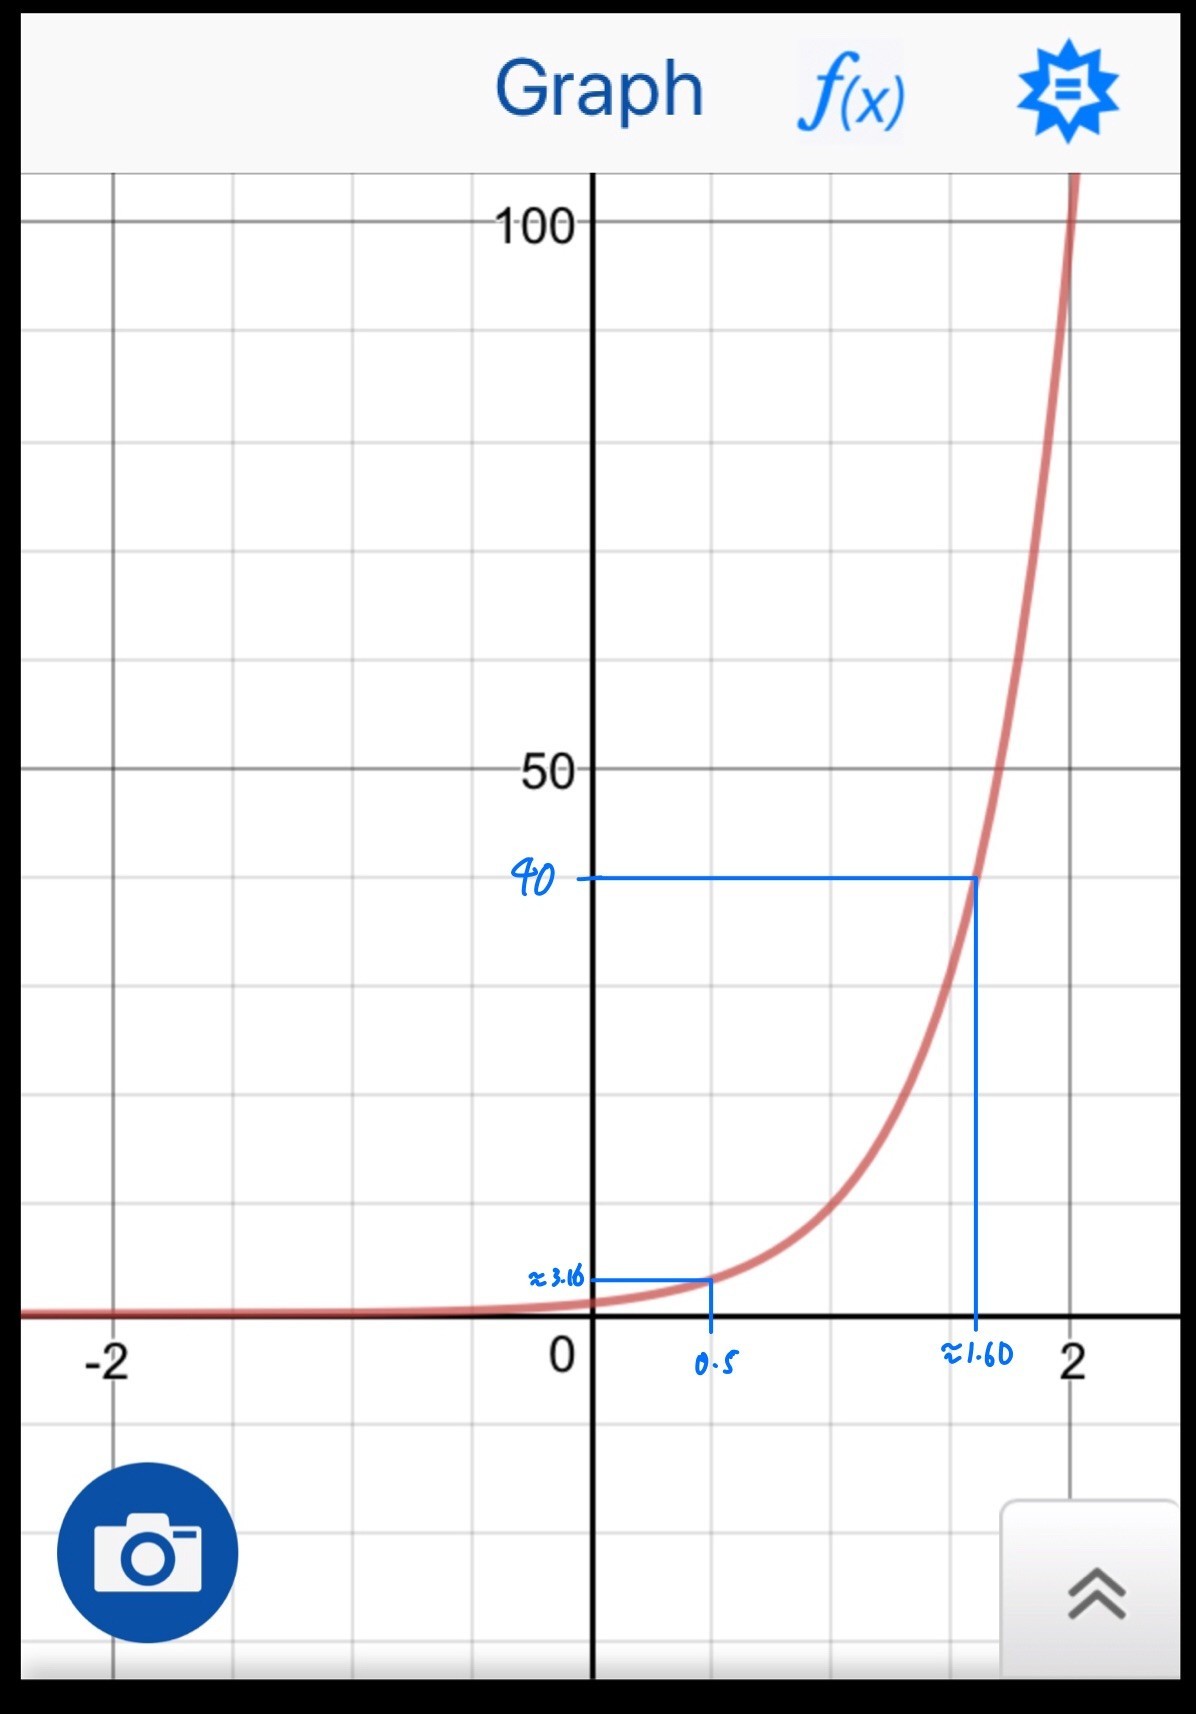
Here's part B and part E
Date Posted:
6 years ago
Just B and E ? ACD ?
I thought I'd leave some qns for you to try yourself. Do you have problems with them too? Oh and please, plot your graph out on a graph paper with an appropriate scale.
Thank you mr. Jiay!


